Browser developer tools make web performance visible before a change reaches review. Their Network, Performance, and Memory panels separate three failure classes: slow or oversized delivery, expensive runtime work, and memory that grows during use. Use them against a performance budget, not only after users report a problem. section 7.0 section 7.1
Use each panel for a distinct diagnostic question:
- Network: inspect page weight, dependency chains, render-blocking resources, and cache headers. Large compressed bundles, long chains, and absent caching point to loading work that delays rendering. section 7.1
- Performance: inspect JavaScript execution, style calculation, layout, and painting. Check Core Web Vitals first, then record a trace to find long tasks, forced layout work, and costly paints. section 7.1 section 7.1.2
- Memory: compare heap behavior across navigations and look for detached DOM nodes or accumulating event listeners. A steadily growing heap signals an instability that short tests can miss. section 7.1 section 7.6
A useful trace is narrow and reproducible. For loading, start a recording with the reload control and let the page settle. For an interaction, start recording, perform one action, and stop. A short recording of a button click is easier to interpret than a long capture of general browsing. Enable CPU throttling before recording when development hardware is faster than the devices users carry; the 4x setting roughly represents JavaScript execution on a mid-range phone. section 7.1.2
Finding layout thrashing
Record a scrolling interaction and read the flame chart from wide, expensive calls down to their causes. In a social widget, a 180 ms task appears whenever the widget enters view. Alternating Recalculate Style and Layout blocks reveal a JavaScript read-write loop forcing repeated reflows. The corrective direction is to remove the repeated layout-triggering pattern, then record the same interaction again and compare it with the budget. section 7.1.2 section 7.0
Table 7.1 Web profiling concerns, tools, and diagnostic patterns
|
Concern
|
Primary tool
|
What to look for
|
|
Loading performance
|
Network panel
|
Large bundles (over 200KB compressed), long dependency
chains, render-blocking resources, and missing cache headers
|
|
Runtime behavior
|
Performance panel
|
Long tasks (over 50ms), layout thrashing, expensive
paints, and poor Core Web Vitals scores
|
|
Memory stability
|
Memory panel
|
Growing heap size across navigations, detached DOM nodes,
and event listeners that accumulate
|
Maps loading, runtime, and memory concerns to the panel that exposes their most common warning signs. section 7.1
Figure 7.3 Layout thrashing in the Chrome DevTools flame chart. The alternating Recalculate Style and Layout blocks in purple show the browser being forced to recalculate layout repeatedly by a read-write loop in the JavaScript above in yellow. The red triangles flag each recalculation as a forced reflow.
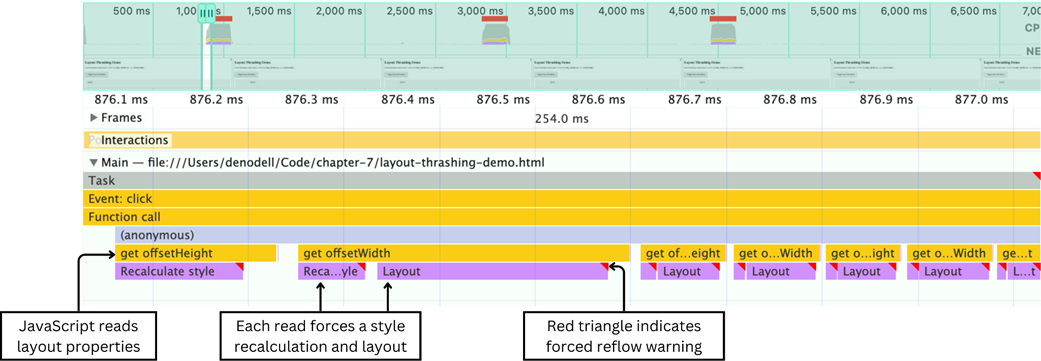
Shows the flame-chart signature of forced reflow: alternating style recalculation and layout blocks caused by a read-write loop. section 7.1.2
Treat profiling as a short development habit: after modifying code, run the relevant check, compare one result with its budget, investigate an overage while the change is fresh, and profile again before review. The same approach applies across browsers: Chrome, Firefox, and Edge expose Network, Performance, and Memory panels; Safari provides comparable capabilities through Network, Timelines, and memory tooling enabled from its Develop menu. section 7.0 section 7.1 section 7.6
Browser-side tooling also applies to Electron windows because they run in browser processes. Profile the affected window rather than assuming another window represents it. Application logic running on Node.js needs separate profiling, and frequent or large messages across the browser–Node.js boundary can cause stuttering that neither view shows alone. section 7.4.2 section 7.4.3