Browser developer tools can serve as both an editor and a debugging surface. In a web project without build tools, a DevTools Workspace can edit source in the browser and keep the code-test-debug cycle together. section 2.5
For storage bugs, inspect the data the browser actually holds rather than guessing what the app wrote. Browser inspectors can also show the real DOM and state directly. section 12.4.8 section 1.6
Inspect these storage areas in DevTools while developing:
- localStorage, IndexedDB databases, and Cache Storage entries. section 12.4.8
- Service workers and origin storage usage. section 12.4.8
Figure 2.11 In Chromium’s DevTools, you can define your Workspace in Sources to edit your source code directly from the browser, eliminating the need for an IDE or code editor.
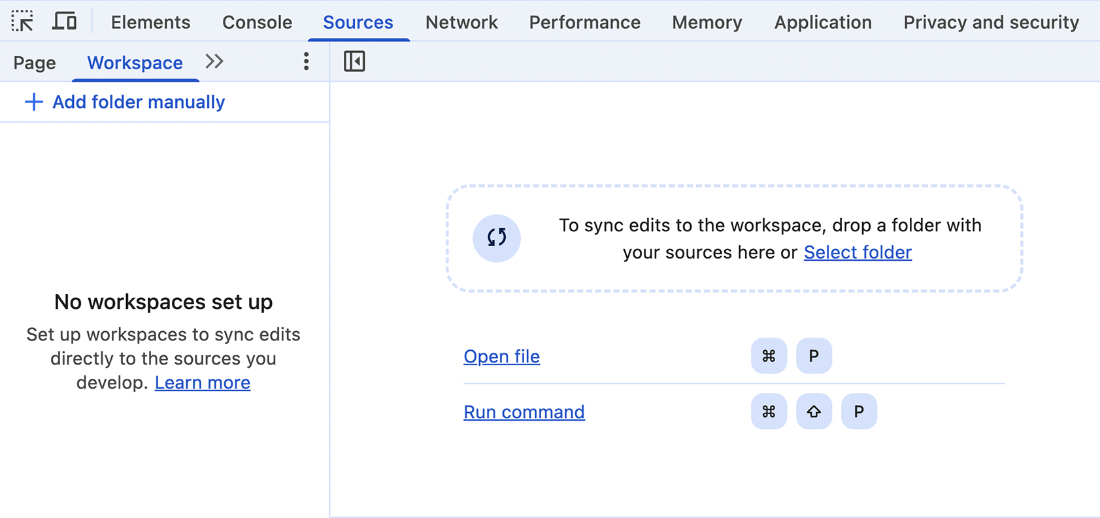
See how a Chromium DevTools Workspace can connect browser-based editing with the source files. section 2.5
Figure 12.3 All browsers let you debug your app’s storage. In Chromium-based browsers, it’s in DevTools in the Application tab. You will find a summary of your storage usage in Application > Storage, followed by separate sections for each API under the storage title in the left navigation bar.
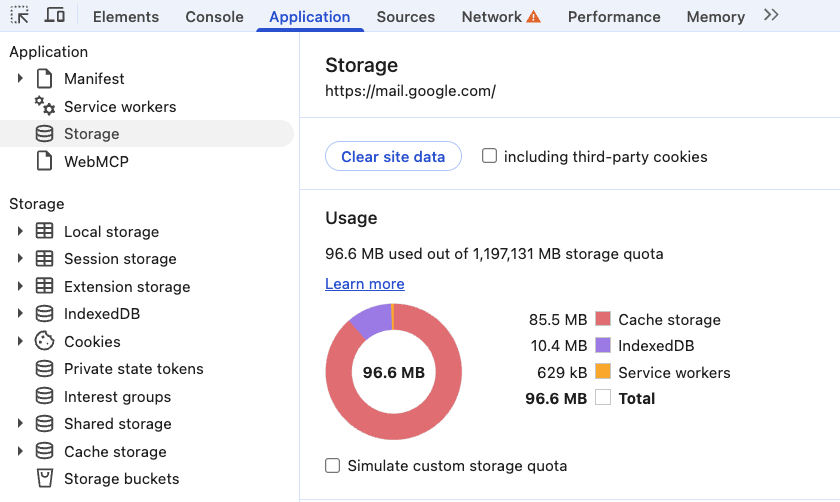
See the Application tab’s storage summary and its separate sections for storage APIs. section 12.4.8