Browser developer tools provide interactive diagnostics for JavaScript applications, exposing heap snapshots, allocation timelines, CPU profiles, and memory graphs. They are built into browser development and can also analyze diagnostic files captured offline. section 11.1.3
Connect runtime environments according to where the code executes:
- Open the browser developer tools menu or press F12; no setup is required. section 11.1.3
- Start Node.js with --inspect, open chrome://inspect, and select the remote target. section 11.1.3
- Use --inspect-brk to pause at the first line before startup behavior occurs. section 11.1.3
- Expect similar V8 diagnostics in Deno, potentially different data in Bun, and limited connection support for Cloudflare Workers. section 11.1.3
Attach before startup
Run node --inspect-brk server.js, open chrome://inspect, and inspect the process before its first line executes. Load .cpuprofile or .heapsnapshot files later when live attachment is impractical. section 11.1.3
Figure 11.7 The Chrome/Edge DevTools Performance Tab provides detailed CPU and wall-time profiling of where your application is spending time.
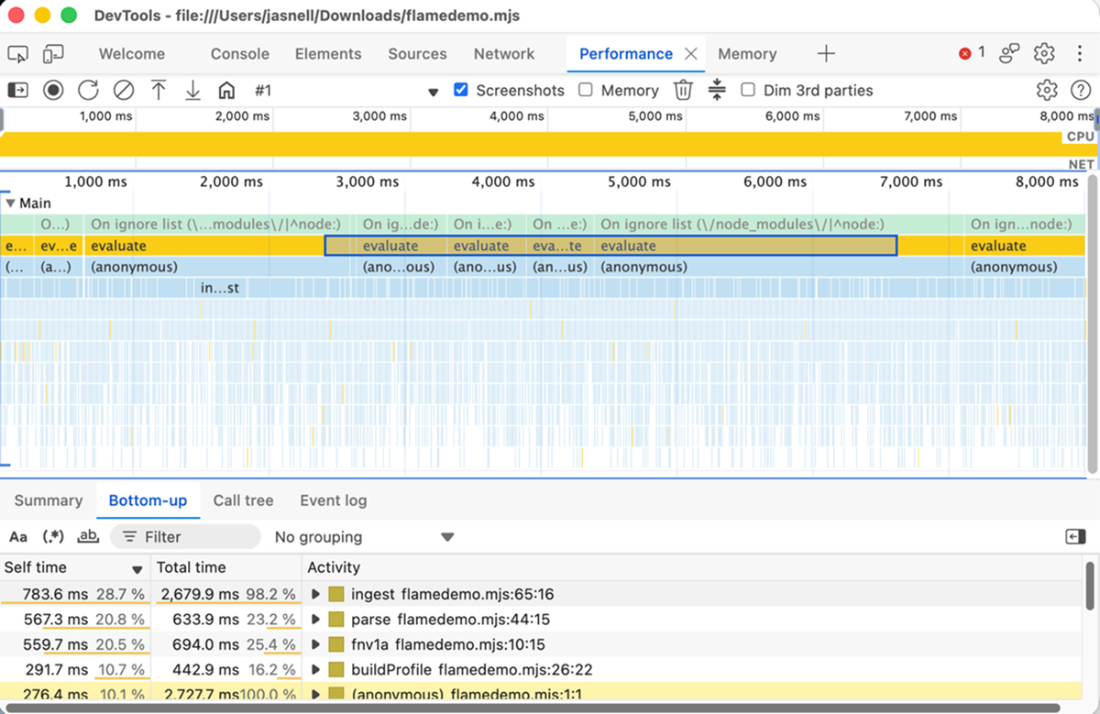
Use the Performance tab to examine CPU and wall-time profiles and locate where an application spends time. section 11.1.3