Class imbalance happens when one class appears far more often than another. A wolf-warning dataset with 1 wolf day and 99 no-wolf days is imbalanced: the rare outcome is a wolf, while “no wolf” dominates. The same pattern appears when there are many non-spam emails but few spam emails. This matters because a model can look successful simply by favoring the common answer. section 8.11 section 8.8
Accuracy can become a trap. In the wolf example, predicting “no wolf” every time produces 99% accuracy, yet it catches no wolves at all. Even a system with 98% accuracy may be failing at the very event it was meant to detect. When the positive event is uncommon, inspect which cases the model gets right and wrong rather than trusting one impressive percentage. section 8.8 section 8.9
Use measures that focus on the event you care about:
- Precision asks: when the model raises an alarm, how often is it right? Low precision means many false alarms. section 8.9
- Recall asks: of all real positive cases, how many did the model find? Low recall means many missed alarms. section 8.9
- A confusion matrix separates true positives, false positives, false negatives, and true negatives, making an accuracy score easier to question. section 8.8
- Thresholds trade precision against recall: becoming more conservative can reduce false alarms but also miss more real events. section 8.9
For performance across thresholds, a receiver operating characteristic (ROC) curve is useful when the classes are roughly balanced. With severe imbalance, prefer a precision-recall curve (PRC), which plots precision against recall. Its area under the curve (AUC) summarizes the curve in one number; larger is better. Do not treat the summary as the whole decision, though: choose a point on the curve based on whether false alarms or missed events are costlier. section 8.10 section 8.11
A wolf alarm that wins at accuracy and loses at warning
Suppose 100 days contain 1 wolf day and 99 no-wolf days. A detector that always predicts “no wolf” earns 99 correct predictions, or 99% accuracy. But its recall for wolves is 0%: it never identifies the one day that matters. A more useful evaluation asks both whether alarms are trustworthy (precision) and whether real wolves are found (recall). section 8.8 section 8.9
Figure 8.9 The precision-recall curve (PRC) for our toddler meltdown dataset
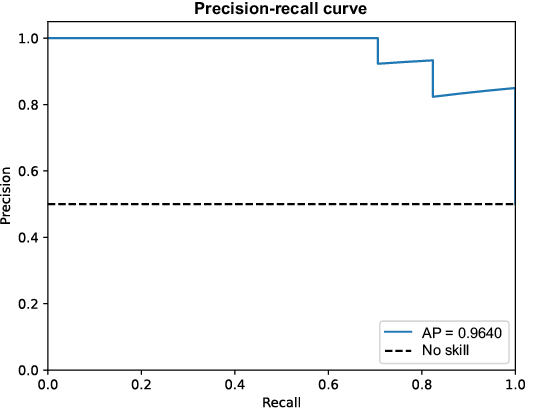
Compare precision and recall at different thresholds. Moving toward higher recall can reveal more meltdowns, while precision may fall as alarms become less selective. section 8.10
Balancing tactics such as oversampling one class or undersampling another may help in some situations, but they are not always available for training or testing. Start by recognizing the imbalance, hold out data for evaluation through train/test splits or cross-validation, and select metrics that reflect the real decision rather than the majority class. section 8.10 section 8.11










