The coefficient of determination, written R² or R-squared, measures how much variation in a regression target the model explains. Values of 0 and 1 represent average-only prediction and perfect explanation, respectively. section 4.5.4
R² is useful, but it is not a trust certificate. Pair it with error metrics and predicted-versus-actual inspection before deciding whether predictions are operationally safe. section 4.5.5 section 4.5.4
Drug-price regression
A Random Forest price estimator achieves R² = 0.3744, explaining about 37.4% of price variation. The result captures some pricing structure but leaves most movement unexplained, so it supports directional analysis rather than a fully trusted final estimate. section 4.5.5
Evaluate R² alongside:
- MAE, which expresses the average prediction error in the target's currency. section 4.5.4
- RMSE, which emphasizes large and potentially painful mistakes. section 4.5.4
- A predicted-versus-actual plot, which can expose increasing variance and under-prediction at higher prices. section 4.5.5
[2] Model Evaluation (Random Forest Regressor):
R-squared (R²): 0.3744 (How much variance is explained by the model)
Mean Absolute Error (MAE): 77.50 INR (Average error in price prediction)
Root Mean Square Error (RMSE): 179.69 INR
Compare R², MAE and RMSE in the model-evaluation output. section 4.5.5
Figure 4.8 Predicted vs. Actual Drug Price: This visualization compares actual drug prices against the model's predictions. The dashed identity line represents perfect accuracy, while the blue dots show real-world performance. The plot illustrates a high concentration of accurate predictions for low-cost medications, with increasing variance and under-prediction as actual drug prices rise.
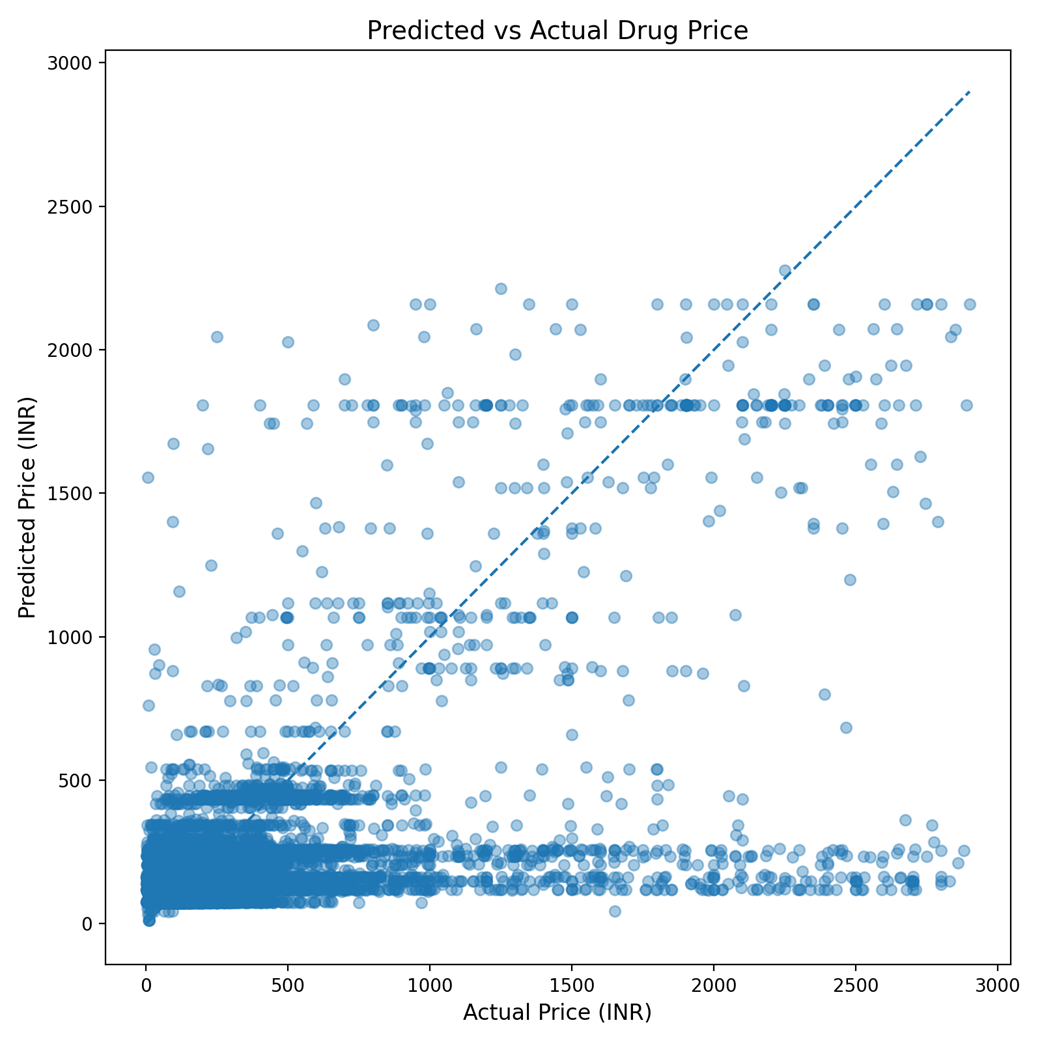
Inspect how predictions distribute against actual prices and where R²'s aggregate score hides uneven performance. section 4.5.5