liveBook · Manning

Column

As explained in Everyday Data Visualization

A column is a vertical field in a table containing values for one attribute across rows.

A column is a vertical field in a table: its name identifies one dimension or measure, while its cells hold that attribute across rows. section 3.5.1

Thinking in tables means reading columns alongside rows, joins, and aggregations. Before interpreting values, identify the table’s grain: what one row represents. section 3.5.1

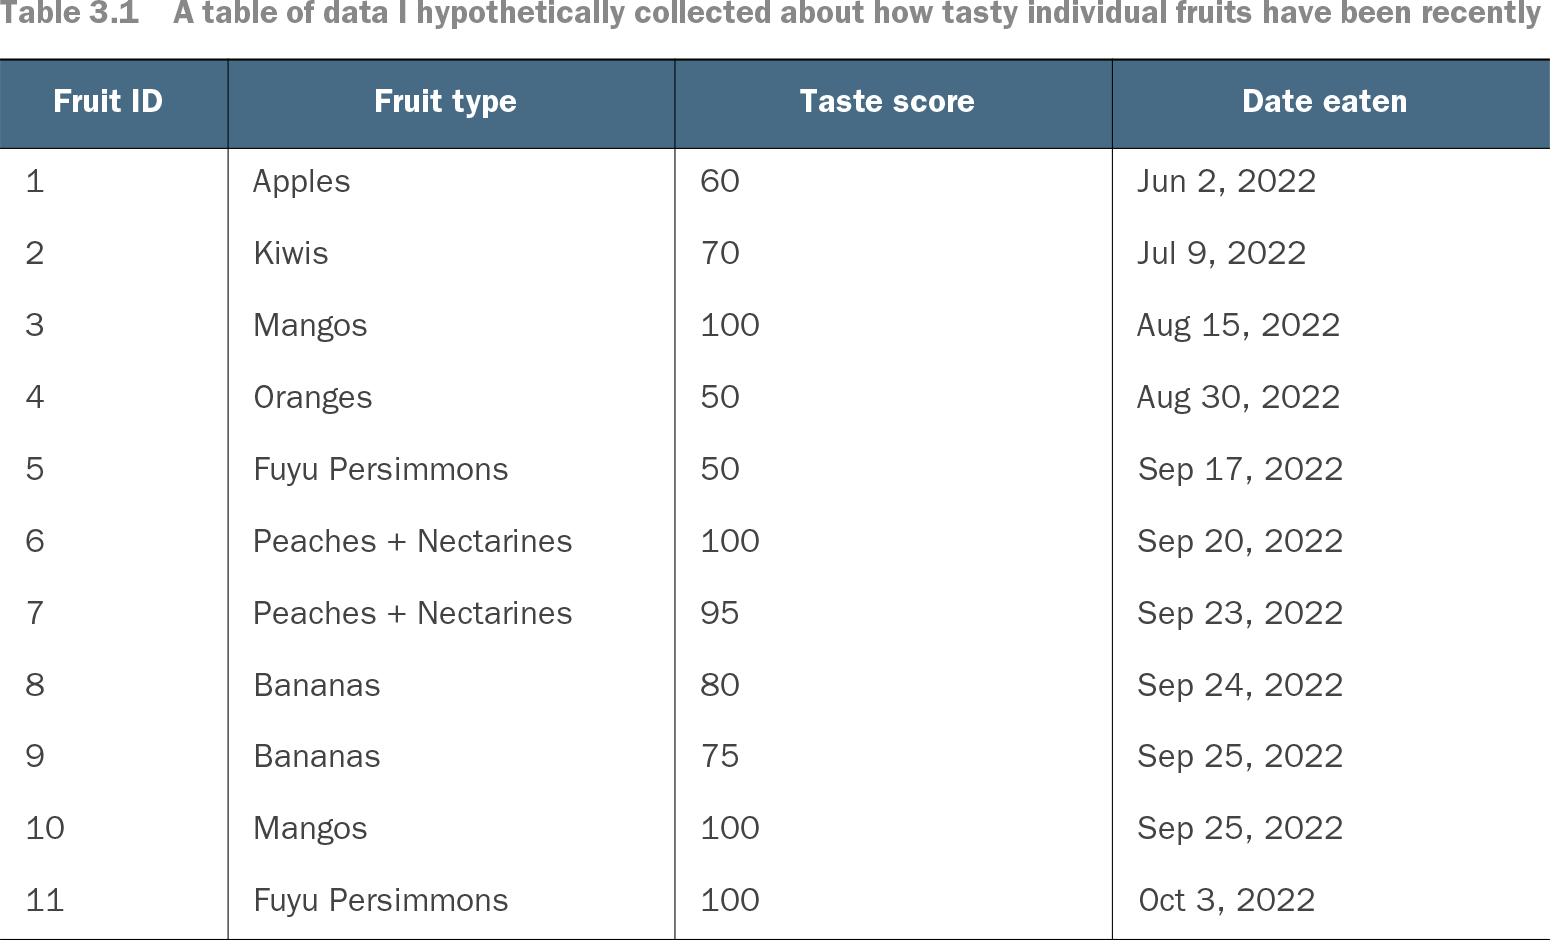
Table 3.1 A table of data I hypothetically collected about how tasty individual fruits have been recently (view table figure)

Fruit ID

Fruit type

Taste score

Date eaten

1

Apples

60

Jun 2, 2022

2

Kiwis

70

Jul 9, 2022

3

Mangos

100

Aug 15, 2022

4

Oranges

50

Aug 30, 2022

5

Fuyu Persimmons

50

Sep 17, 2022

6

Peaches + Nectarines

100

Sep 20, 2022

7

Peaches + Nectarines

95

Sep 23, 2022

8

Bananas

80

Sep 24, 2022

9

Bananas

75

Sep 25, 2022

10

Mangos

100

Sep 25, 2022

11

Fuyu Persimmons

100

Oct 3, 2022

The fruit table makes columns concrete: Fruit ID, fruit type, taste score, and date eaten describe different attributes for each fruit record. section 3.5.1


How Everyday Data Visualization covers it

How deep it goes
Defines columns and connects them to dimensions and measures, while emphasizing grain rather than implementation internals.
Examples
Uses a fruit-tasting table and banking tables organized by transactions, days, or accounts.
What you can do after
Apply columns to read tables, identify attributes, and interpret rows at the correct grain.
How it connects
Connects columns with rows, table grain, dimensions, measures, joins, aggregations, SQL, and business-intelligence tools.

Also explained in

Compare how 9 books explain column →

Related concepts

This explainer was generated by Manning's knowledge graph from the text of Everyday Data Visualization. The section links point to the parts of the book it draws on.