A confounder is a variable that affects both a treatment or decision and the outcome of interest. It can create an association that makes a simple comparison misleading: the observed difference may reflect the treatment, the confounder, or both. section 1.4.2 section 2.0
Medication and age
Suppose a new medication is given more often to older patients, while age also affects recovery. Age is then a confounder: comparing recovery averages between medications cannot isolate the medication’s effect because the treatment groups differ in age. section 1.4.2
Confounding is especially important with observational data, where treatment assignment is not controlled. A positive correlation does not establish a positive causal effect: Simpson’s paradox can even reverse the apparent direction when cases differ in severity, such as kidney-stone size. section 2.0 section 2.1.2
A practical causal analysis handles confounders by:
- Listing variables that may have shaped the data, including known, unobserved, and uncertain factors; consult domain experts to avoid omitting relevant confounders. section 3.2 section 3.2.1
- Drawing a directed acyclic graph that states the assumed causal relationships among treatment, outcome, and other variables. section 1.1.3 section 3.6
- Conditioning on measured confounders so their values are held fixed, then combining the relevant comparisons with the adjustment formula. section 2.1.2 section 1.1.5
- Checking positivity: each confounder profile needs data for the treatments being compared. Many confounders make this requirement increasingly demanding. section 2.5.5 section 2.9
Randomized controlled trials and A/B tests avoid confounding through random treatment assignment when feasible. Otherwise, make explicit which confounders are measured and which are missing; unobserved confounding can make a causal analysis infeasible or require another approach. section 1.8 section 3.2.1
Discounts and purchase frequency
If frequent customers receive larger discounts and also tend to purchase more, historical purchase frequency confounds the estimated effect of discount on purchasing. Randomly giving different discount levels across frequency groups helps preserve positivity. section 3.3.2
A confounder is a shared cause affecting both the treatment and the outcome. When a confounder is present, it prevents us from accurately measuring the treatment’s effect by comparing averages.
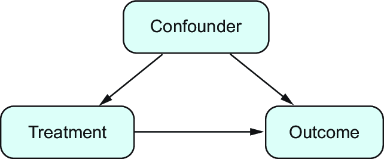
Use the graph to distinguish the treatment-to-outcome path from a shared cause that affects both variables and biases a comparison of averages. section 2.0




