A debugger runs an application under controlled execution so you can pause it at a breakpoint and inspect its state. Use one when logs or tests do not reveal the cause of a problem in a Rust application. section 6.3
At a breakpoint, inspect values such as a variable’s contents and follow the call stack to check whether data and function results match expectations. Step through execution to see how the application reaches that point. section 6.3 section 6.3.3
Choose a workflow that fits your setup:
- For command-line debugging, build the application, launch it with rust-gdb, set a breakpoint by function or source location, run, continue, and print values. GDB must be installed separately; availability depends on the operating system. section 6.3.1
- For Visual Studio Code, install CodeLLDB, set a breakpoint beside a line number, and start debugging through the UI. Inspect variables and the call stack, or use Step Over to advance. section 6.3.3
- Visual Studio Code creates a launch.json file in .vscode; adjust it when the debugger needs settings such as environment variables. section 6.3.3
$ cargo build                                         #1
$ rust-gdb target/debug/NAME_OF_YOUR_APPLICATIONS     #2

(gdb) b main:11                                       #3
(gdb) b src/routes/question.rs:11                     #4
(gdb) r                                               #5
...
(gdb) c                                               #6
...
(gdb) p store                                         #7
...
Example command-line sequence for building a Rust application, setting breakpoints, running it, and inspecting a value. section 6.3.1
Figure 6.4 Birds-eye view of the debugging setup. A debugger attaches itself to the process of our Rust application, and uses kernel interrupt events to step in, pause the process, and display the state.
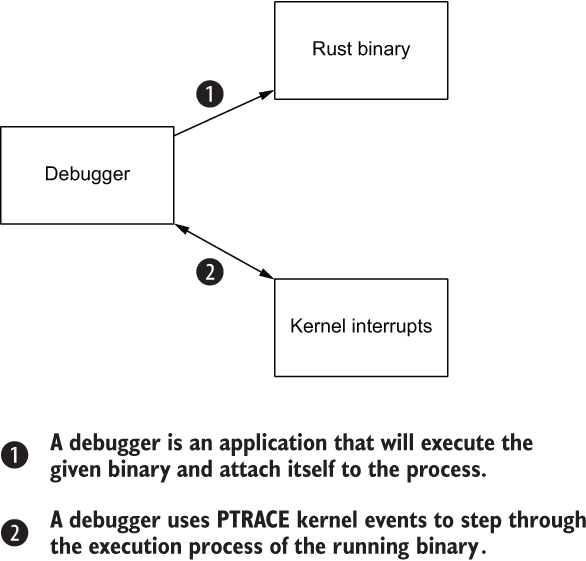
Diagram of a debugger pausing a Rust application and displaying its state. section 6.3