Descriptive statistics summarize a dataset’s main characteristics and support exploratory data analysis. They commonly appear alongside visualizations, whether calculated manually or produced by automated EDA tools. section 20.9
Useful workflows include:
- Baseline a dataset and return summary results in tables with tableone. section 20.9
- Inspect tabular and visual patterns with DataExplorer, including opening and closing totals. section 20.9
- Use SmartEDA for initial insights before applying further statistical techniques. section 20.9
- Combine summary statistics with manual data exploration, wrangling, plotting, and correlation analysis. section 20.9
Opening versus closing betting lines
An exploratory analysis compared opening and closing totals and point spreads. Automated summaries and visualizations indicated that closing lines were usually more accurate than opening lines. section 20.9
Figure 20.9 We computed summary, or descriptive, statistics in every chapter and then visualized the same by demonstrating a wide range of plotting techniques. However, the manual EDA exercises in chapters 2, 5, 6, 10, and 14, plus the automated EDA demonstrations in chapter 17, were more exhaustive than like efforts from other chapters.
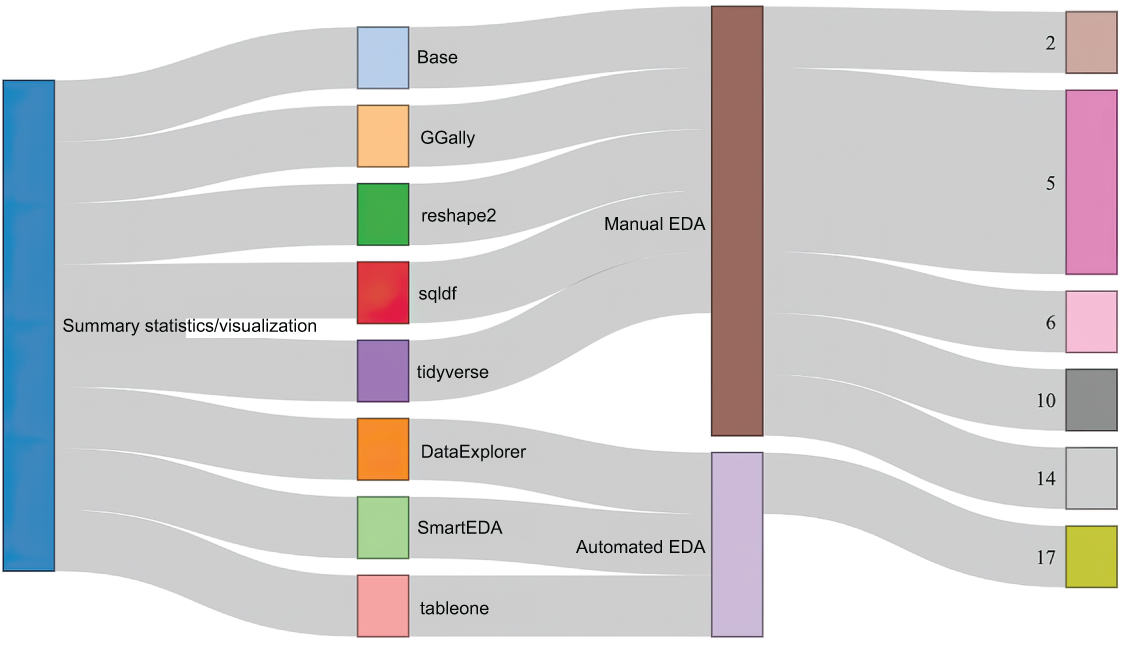
Visualize how summary statistics recur across analytical work and connect with plotting techniques, manual EDA, and automated EDA. section 20.9





