The DIKW hierarchy is a practical path for turning raw data into a data story that helps an audience act. It moves through four levels: data, information, knowledge, and wisdom. Rather than treating a chart as the finished result, it progressively adds meaning, context, and a next step. section 1.4 section 1.5
Figure 1.8 The DIKW pyramid
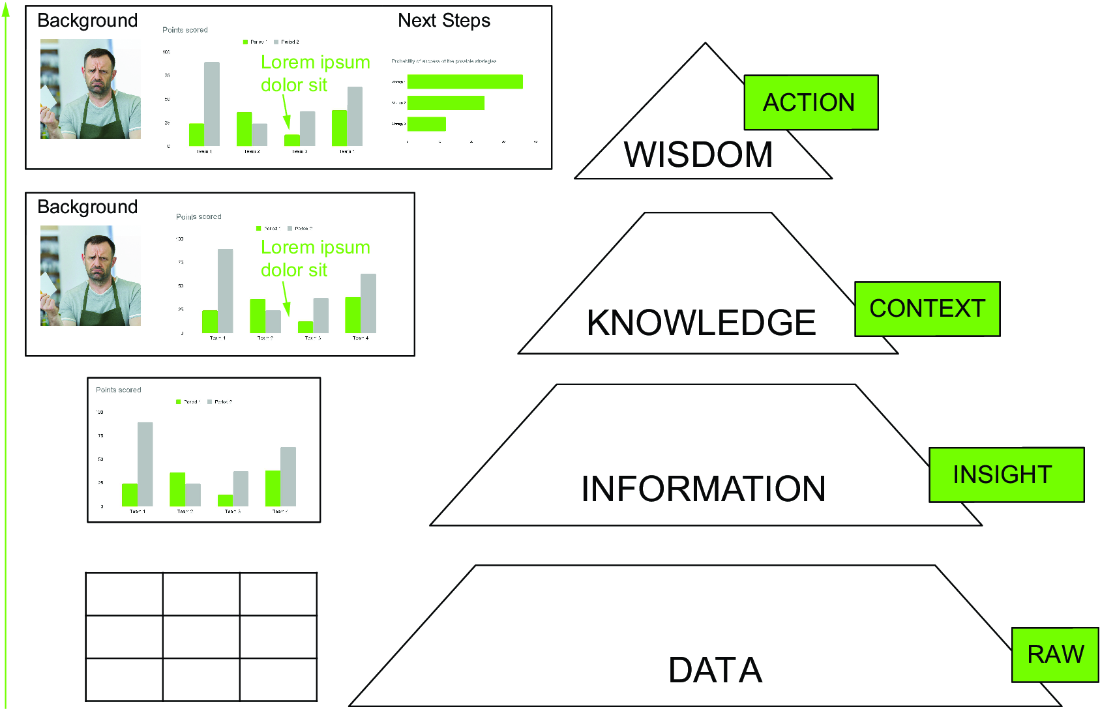
Read the hierarchy bottom-up: begin with available data, organize it into understandable information, interpret it in context as knowledge, then add ethics and an invitation to act as wisdom. section 1.4
Use the levels as a story-building workflow:
- Start with data: a substantial, usually cleaned collection of raw values. section 1.4
- Extract information: select and organize meaningful insights so they are easy to understand. section 1.4 section 2.5
- Add knowledge: explain the background that lets the audience interpret the insight. section 1.4 section 5.2.1
- Create wisdom: pair the contextualized finding with ethical consideration and a clear call to action or next steps. section 1.4 section 5.2.1
The hierarchy maps directly to a data-storytelling arc. An extracted insight supplies the main point; context supplies background and raises audience interest; a call to action invites reflection and follow-through. Build in the useful order: identify the main point, set the background, then define next steps. section 5.2.1 section 5.6
Pet-event participation
A pet-event dataset begins as participant counts. Finding that 1 in 10 participants is a dog turns the counts into information. Explaining that weak dog advertising discouraged owners supplies knowledge. Calling for increased dog advertising turns the story into wisdom. section 1.4.3
A raw visualization can reveal an insight yet still fail to persuade. A chart without context or motivation remains exploratory; a complete explanatory story adds a background and next steps tailored to the audience’s decision. section 5.1.2 section 5.2.1
Generative AI can support each transition: generate chart-building code while extracting insights, improve contextual text or media, and suggest engaging calls to action. It assists the workflow rather than replacing audience-focused judgment. section 5.3 section 2.0
