The effect of treatment on the treated, usually called ATT or ATET, asks a focused causal question: among people who actually received a treatment, how much did it change their outcome? It averages the difference between their observed treated outcomes and the outcomes those same people would have had without treatment. The latter outcome is counterfactual, so it is not directly observed. section 11.4.2 section 11.4.4
This differs from the average treatment effect (ATE), which targets a broader population. ATT restricts attention to treated units. That focus is useful when available controls can represent every treated unit but cannot represent every control unit; in that case, ATT may be estimable while the reverse estimand, the average treatment effect on controls (ATC), is not. section 5.3.3 section 5.3.4
Comparable patients
Suppose treated patients have propensity scores from about 0.6 to 1, while controls range from about 0.3 to 1. Every treated patient has a comparable control, so treatment effects can be estimated for treated patients. But some controls lack a comparable treated patient, preventing estimation of an effect for all controls. section 5.3.3
Figure 5.12 The distribution overlap consists of the treated. In this case, we can calculate the (ATT).
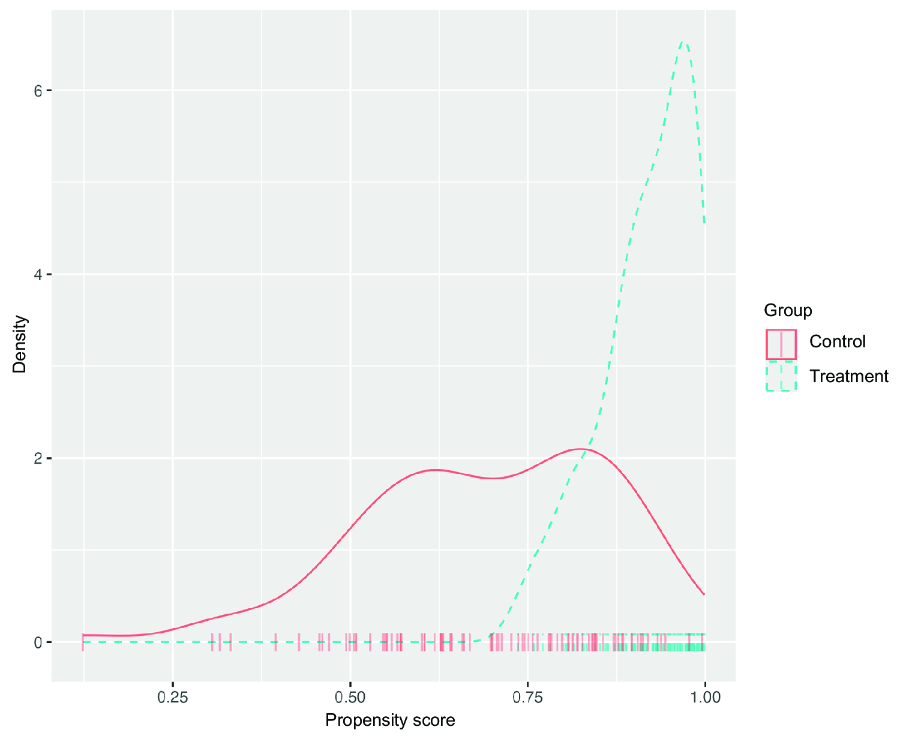
Use the overlap plot to check the special case where the common support covers the treated group, supporting an ATT target. section 5.3.3
Matching naturally produces ATT when it pairs each treated unit with one or more controls and then averages treated-versus-matched-control differences. With unequal group sizes, controls may be reused when treated units outnumber them. Using only one match can be unstable when outcomes vary, motivating k-nearest-neighbor matching rather than reliance on a single control. section 5.3.4
A time-related event
For a movie release, ATET is the effect of the release on movies that received it, compared with the hypothetical outcome those movies would have had without a release. In difference-in-differences, the treated group’s before-to-after change is adjusted by the untreated group’s before-to-after change to recover this target under the parallel paths assumption. section 11.4.2 section 11.4.4
Practical routes to estimating ATET include:
- Apply the difference-in-differences direct formula to treated and untreated group means before and after the event. section 11.4.5
- Fit a linear model with treatment, time, and their interaction; the interaction estimates ATET in the stated specification. section 11.4.5
- Use bootstrap resampling to form confidence intervals, or use DiD-oriented R and Python packages for richer specifications. section 11.4.5
ATT does not license claims about untreated people. Under heterogeneous treatment effects, an estimate for chatbot users says how use affected users, not how nonusers would respond if they began using it. The estimand’s population is therefore part of the conclusion, not merely an implementation detail. section 10.4

