A false-positive rate measures how often a statistical test incorrectly concludes that version B is better than version A. In an A/B test, the conventional limit is α = 0.05, or 5%. section 2.3.2
The error has a direct production cost: switching to an inferior version can reduce quality, increase costs, or decrease revenue. A false negative instead misses an improvement without making the system worse, so experiments commonly tolerate β = 0.20. section 2.3.2
Design an A/B test around the desired false-positive rate:
- Specify a practically significant difference rather than treating every measurable difference as valuable. section 2.3.2
- Estimate the standard deviation of the difference and choose enough individual measurements to place the decision threshold at the intended error rate. section 2.3.2
- Add power analysis when limiting false negatives as well as false positives; the illustrative calculation returns 7 measurements without power analysis and 16 with it. section 2.3.2
Why changing metrics after the test is risky
Suppose a model fails to improve thumbs-up rate but improves comment rate. Switching the business metric after inspecting results is cherry-picking: with M independent metrics and no real improvement, the chance that at least one produces a false positive is 1 − 0.95^M, which grows above 5% as M increases. section 8.3.1
Listing 2.6 A/B test design
def ab_test_design(sd_1_delta, prac_sig):
    num_individual_measurements = (1.64 * sd_1_delta / prac_sig)**2   #1
    return np.ceil(num_individual_measurements)                       #2
Use the compact A/B-test design function to connect the 5% threshold, estimated variability, and practical significance to a minimum measurement count. section 2.3.2
Figure 8.4 The probability of any one of a family of metrics generating a false positive versus the number of metrics, M, in the family
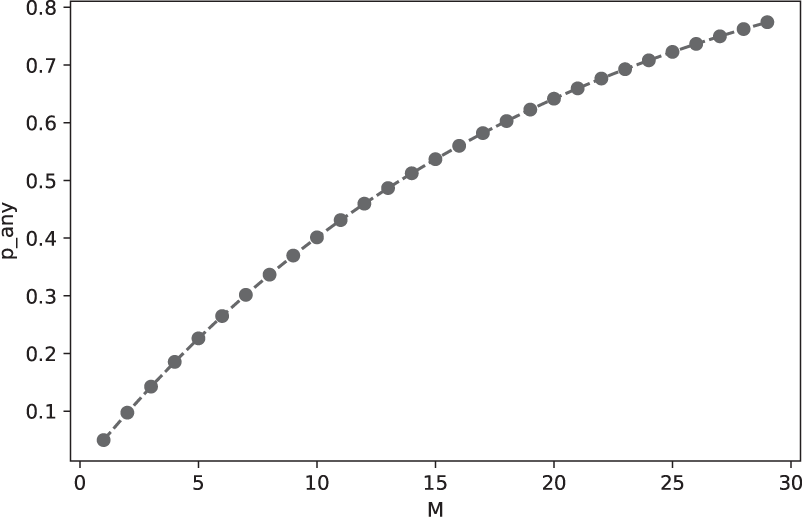
Inspect how the probability of at least one false positive rises across a family of metrics instead of evaluating each metric in isolation. section 8.3.1








