Feature selection narrows the input variables used by a predictive model. For binary logistic regression, class-wise plots can help identify promising predictors and those that may be less useful. This differs from prioritizing product features under budget and resource constraints. section 5.2.1 section 8.1.3
Use exploratory comparisons to screen candidate predictors:
- Compare each variable’s distribution across outcome classes; clearer separation may indicate greater predictive potential. section 5.2.1
- Inspect pairwise correlations between numeric variables to understand their relationships. section 5.2.1
Raisin classification
Class-wise histograms suggest that MajorAxisLength and Perimeter may be useful predictors because their distributions differ between classes; Eccentricity and Extent appear less promising because their distributions are more similar. section 5.2.1
Figure 5.2 A grid of histograms that displays the data distributions of each numeric variable in the raisins data frame, further segmented by the binary variable Class.
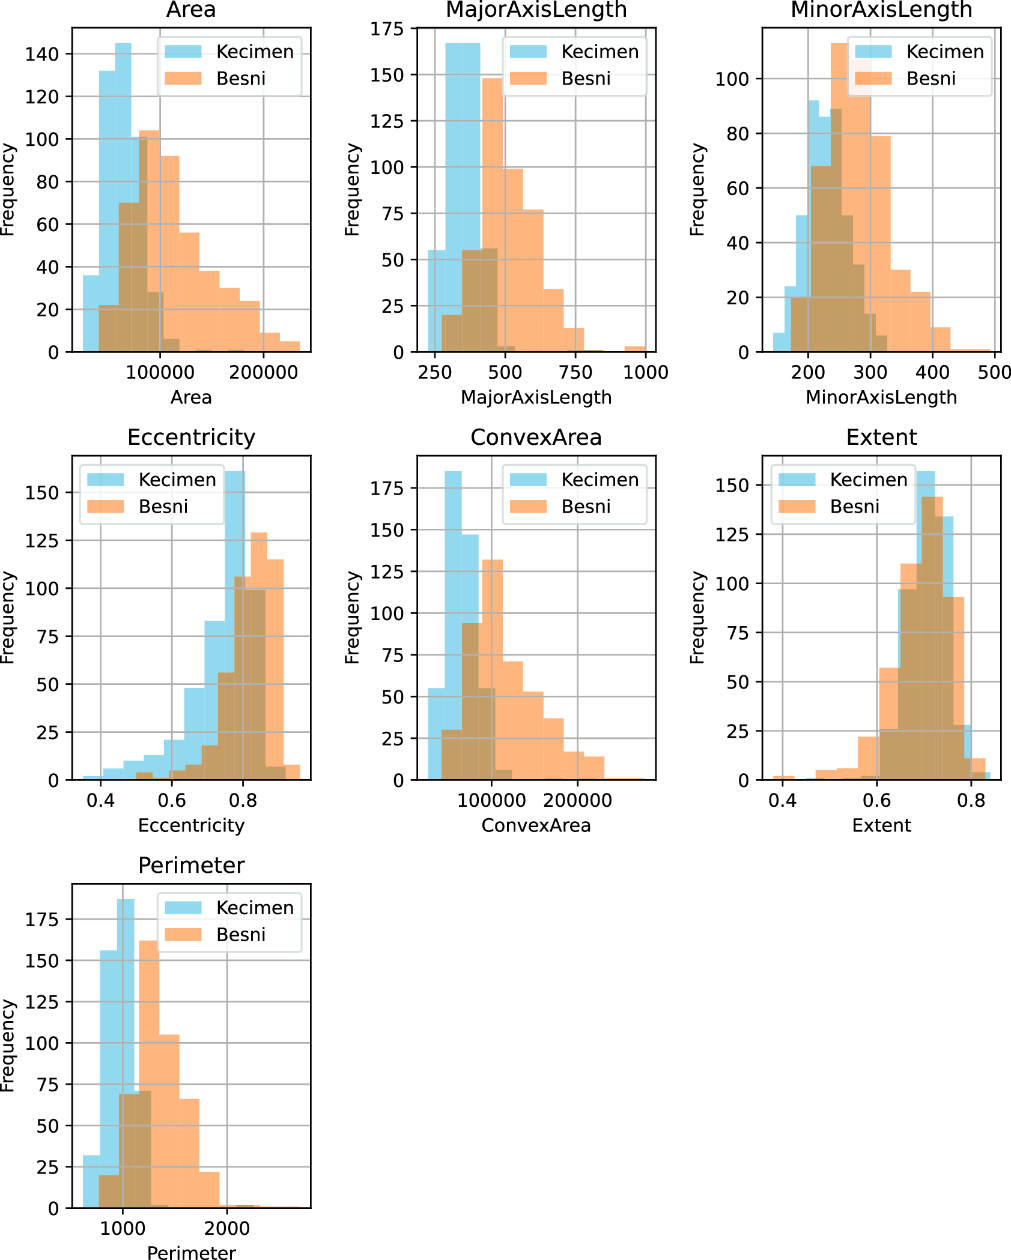
Compare the distributions of numeric raisin variables across the two classes. section 5.2.1







