A single Gaussian struggles when data have several peaks, such as distinct customer spending patterns. A Gaussian mixture represents those peaks by combining several Gaussian components. section 8.1
Each component contributes a recognizable part of the overall distribution:
- The mixture weight wₖ describes how prevalent component k is; all weights lie between 0 and 1 and sum to 1. section 8.1
- The mean μₖ locates a mode, while the standard deviation σₖ describes its spread. section 8.1
- Several components can capture multimodal data more faithfully than one broad or narrowly fitted Gaussian. section 8.1
- Bayesian mixture models can represent uncertainty in centers, spreads, prevalences, and each observation’s hidden membership. section 8.12
Where Gaussian mixtures help
Applications include segmenting customers by recency, frequency, and monetary behavior; identifying bimodal gene expression associated with cancer-related mutations; and modeling household consumption classes. section 8.11
Figure 8.2 A single Gaussian distribution cannot adequately model multiple modes within the data. The situation calls for a mixture model, where each component is responsible for capturing a mode.
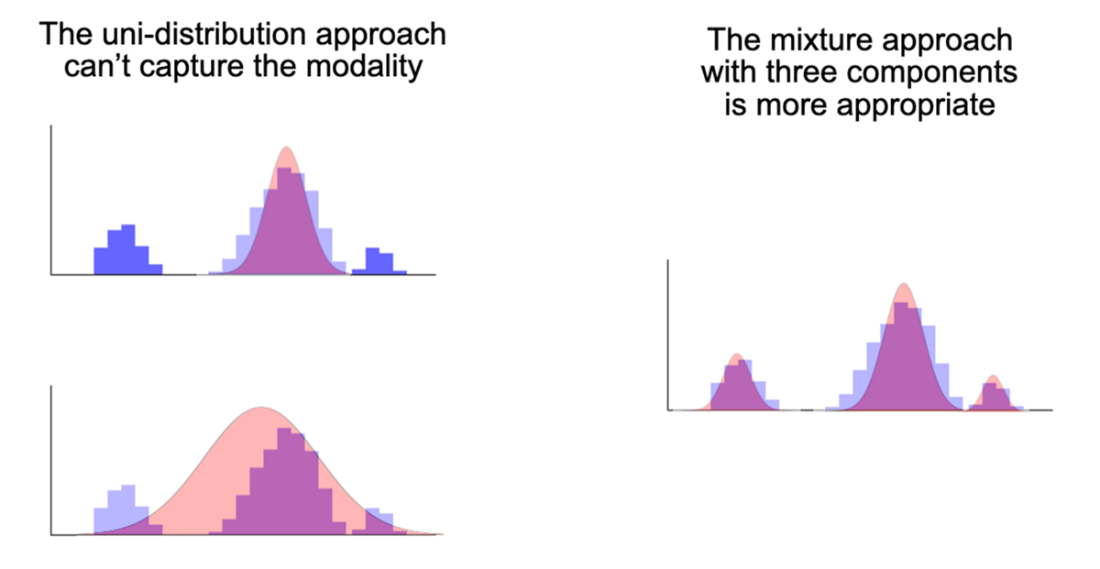
Compare a single Gaussian with a mixture whose components separately capture multiple modes. section 8.1