Grafana is an open-source observability and visualization platform for querying, displaying, and alerting on data from multiple sources. It provides a unified operational interface for metrics, logs, and traces. section 5.3.1
A Grafana deployment can support:
- Dashboards that visualize metrics from Prometheus, logs from Loki, and traces from Tempo. section 5.3.1
- Alerts based on operational conditions, with rules and dashboard settings persisted in Postgres. section 5.3.1
- Human and automated access through the Grafana user experience or programmatic CI/CD interactions. section 5.3.1
Reliability monitoring
A payment-processing team can combine SLOs and SLIs with Prometheus and Grafana dashboards, enabling real-time insight and earlier detection of reliability problems before users are affected. section 10.4.2
Figure 5.8 Most observability platforms, whether open source software or commercial, will use a similar high-level architecture. Specific technology components will be different depending on scale, but understanding this footprint will be important when considering build versus buy options.
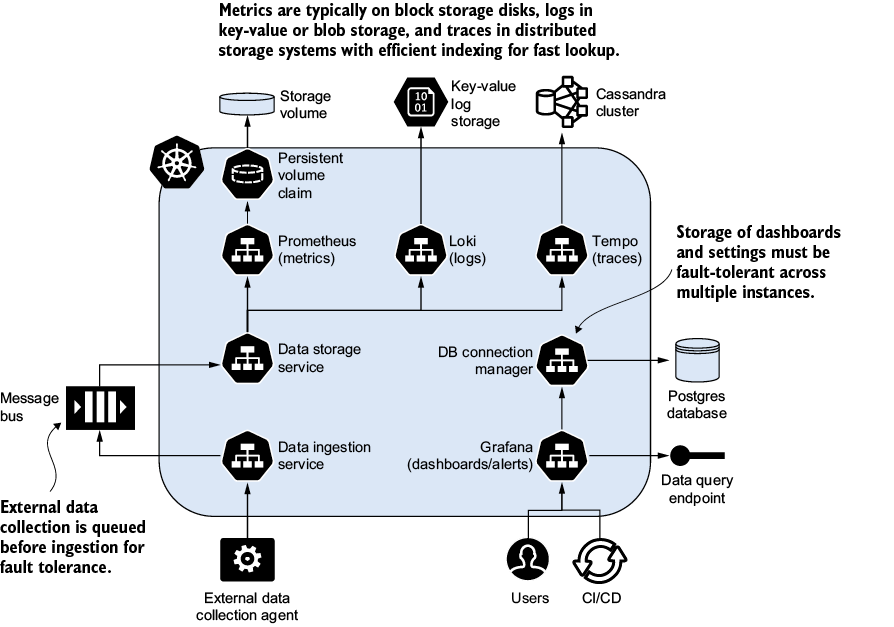
Use the architecture view to evaluate the common observability footprint and reason about build-versus-buy choices across different scales. section 5.3.1








