Grafana is an open-source dashboarding tool for tracking application metrics. It connects to Prometheus and other data sources, turns queries into charts, and provides dashboards for operational visibility. section 3.5
A production metrics workflow connects application instrumentation to dashboards:
- Expose application metrics through an endpoint such as /metrics. section 3.5
- Let Prometheus scrape and index those metrics in its time series database. section 3.5
- Query the Prometheus data source with PromQL and visualize results in Grafana charts. section 3.5
- Install Grafana with Helm, configure persistence, and register Prometheus as a data source. section 3.5
Request-rate dashboard
A PromQL query can group the increase in requests over ten minutes by response code, then display the resulting time series in Grafana. section 3.5
Figure 3.17 Application 1 and Application 2 expose an endpoint for metrics. Prometheus scrapes those metrics, which are then visualized by Grafana. Alertmanager uses those metrics to check if any alerts need to be routed to a channel; in this case, it’s an email.
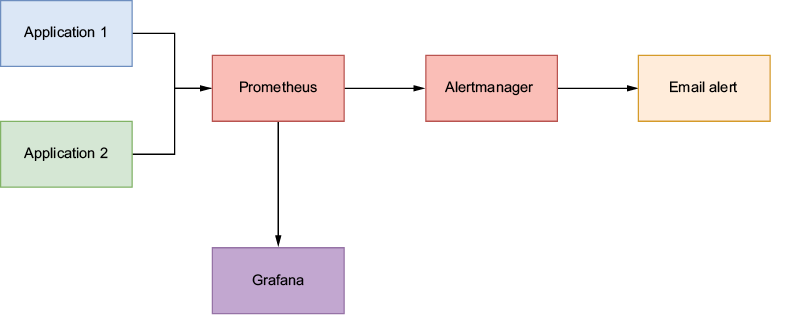
Follow the metrics path from application endpoints through Prometheus scraping to Grafana visualization and Alertmanager routing. section 3.5








