Hierarchical clustering organizes an unlabeled dataset into nested groups rather than producing only one flat partition. The result can be viewed at different resolutions by selecting a snapshot of the hierarchy. section 5.7.3 section 12.1.2
Agglomerative hierarchical clustering develops the hierarchy incrementally:
- Start with every point in its own cluster. section 5.7.3
- Repeatedly merge two points and their clusters until everything belongs to one cluster. section 5.7.3
- Keep the merge history so different stages can be selected as useful partitions. section 5.7.3
A dendrogram records this process as a tree. Earlier joins represent stronger inferred relationships: if A and B join before C joins them, A and B are treated as more closely related than either is to C. section 5.7.3
Hierarchical clustering produces a multi-layer partitioning, while partitioning or flat clustering produces groups that do not contain one another. A hierarchy can therefore be sliced at a chosen level, with the result controlled by algorithm parameters. section 12.1.2 section 12.4.4
Customer segmentation
Given customer attributes such as purchasing habits, financial situation, demographics, age, education, and location, clustering can infer groups without preassigned labels. A hierarchy lets analysts inspect broad groups and finer subgroups rather than committing to one partition immediately. section 12.0 section 5.7.3
Figure 5.15 An example of hierarchical clustering. On the left, the dataset (a collection of 2-D points) is shown with progressive grouping shown as ellipses. From the figure, it can be inferred that, for instance, A and B are grouped together before C is added to the two of them to form a larger cluster. Hence, the relationship between A and B is inferred to be stronger than the one between A and C or B and C. On the right, the same process is shown using a dendrogram.17 Note that both figures could be the result either of agglomerative or divisive clustering: the former produces the dendrogram starting from the bottom, the latter starting from the top.
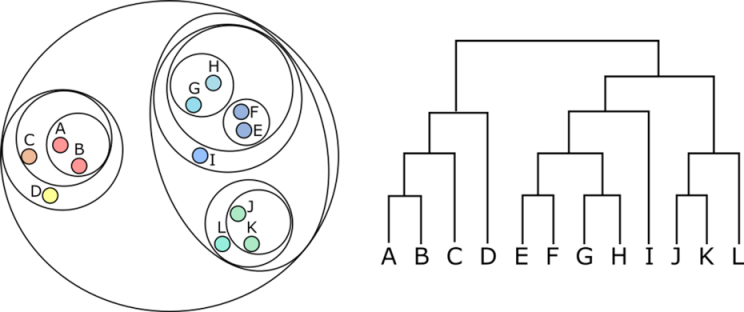
Compare progressive grouping in a two-dimensional dataset with its dendrogram representation, including agglomerative and divisive construction directions. section 5.7.3