Hierarchical clustering is an unsupervised method for finding structure in data without predicting a response variable. It starts with every observation in its own cluster, repeatedly merges similar clusters, and ends with one overall cluster. A dendrogram—an upside-down tree—shows the resulting nested hierarchy. section 3.9 section 20.1
Use it when a segmentation question calls for groups based on similarity and the number of groups is not known in advance. Unlike k-means clustering, it does not require an optimal cluster count beforehand, although it can become slow on large data sets. Common applications include customer segmentation using demographics and purchases, as well as biological and social-science analysis. section 3.9 section 20.1
A practical R workflow is:
- Select the variables that define similarity. For NBA draft selections, use pick number (Pk) and career win shares (WS), then calculate mean win shares for each first-round pick number. section 3.9
- Calculate Euclidean distances between the observations and store them in a distance matrix. section 3.9
- Run hclust() on that matrix, using complete linkage, then convert the result to a dendrogram and plot it. section 3.9
- Draw boxes for a chosen K to inspect a useful split in the hierarchy; K = 2 separates picks 1–5 from picks 6–30 in this analysis. section 20.1
Draft-pick career expectations
Mean career win shares for first-round selections in the 2000–2009 NBA drafts form a distance matrix across 30 pick numbers. The dendrogram’s two-cluster view places picks 1–5 together and picks 6–30 together, supporting different career expectations for top-five selections versus other first-round picks. section 3.9 section 20.1
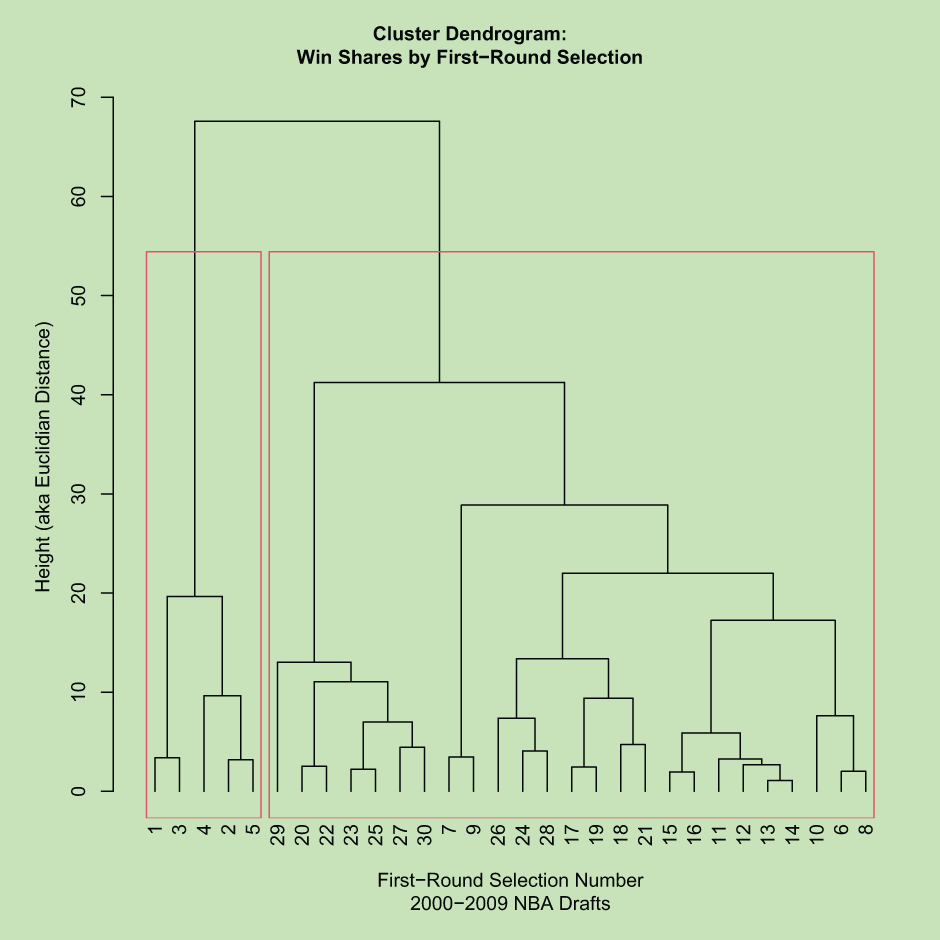
Inspect the dendrogram to see draft-pick clusters on the x-axis and their Euclidean-distance height on the y-axis. section 3.9