K-means clustering groups similar data points by choosing random centers of mass and moving them closer to the points until they settle into useful positions. section 2.11
A simple way to picture the process is:
- Start with several randomly placed centers. section 2.11
- Move the centers toward the data points they represent. section 2.11
- Use the resulting groups to find patterns in unlabeled data, such as customer segments or recommendation groups. section 2.11
Figure 2.5 A plot of the email dataset. The horizontal axis corresponds to the size of the email and the vertical axis to the number of recipients. We can see three well-defined clusters in this dataset.
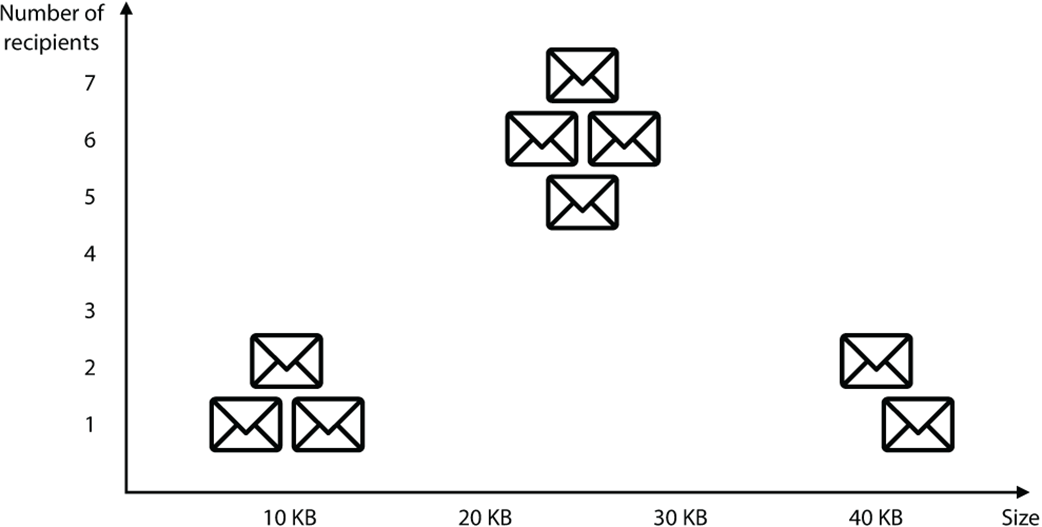
An email dataset plotted by message size and recipient count forms three visible clusters; a companion view groups those emails into three categories. section 2.11