A cohort is a subgroup of users defined by shared characteristics, such as language, geography, or tenure. For comparisons over an evaluation period, a stable cohort has characteristics that remain sufficiently consistent. Cohort analysis helps reveal who benefits from a product and who may be underserved when overall averages look healthy. section 8.4.1 section 3.4.4
Choose cohorts and metrics to match the product decision. A recommender aimed at overall retention may prioritize average effects; one intended to support underserved users should measure subgroup gains directly. Differences between groups are signals for investigation, not automatic proof of bias or harm. section 8.6.1 section 3.4.4
Use cohorts across the evaluation lifecycle:
- Define user segments and compare offline recommendation outputs. Use user attributes and movie metadata to calculate exposure measures, such as genre proportions, language coverage, or catalog diversity. section 3.1.1
- Carry important cohorts into the A/B test. Log attributes such as language, geography, and tenure; stratify the experiment by cohort and apply subgroup non-inferiority margins alongside the global metric. section 8.4.1
- Investigate gaps before deciding on a response. Depending on the finding, improve metadata, add region-aware ranking features, adjust personalization, or collect better feedback from affected users. section 3.4.4
Heavy and casual viewers
In a movie recommender A/B test, heavy users may benefit from a new personalization model while casual users see little change. The average can make the effect look small even when a meaningful subgroup gains. A few binge users can also dominate watch-time metrics and inflate variance. Whether to emphasize subgroup results or reduce variance around activity level depends on the product goal. section 8.6.1
Figure 8.2 illustrates how raw averages can flatten heterogeneous effects. In this movie recommender example, heavy users show a clear lift in watch time under the new model, while casual users see little to no change. When averaged across all users, the treatment effect looks much smaller than it does for the subgroup that benefited most. This illustrates why top-line A/B results can mislead in AI evaluations without subgroup analysis or variance reduction.
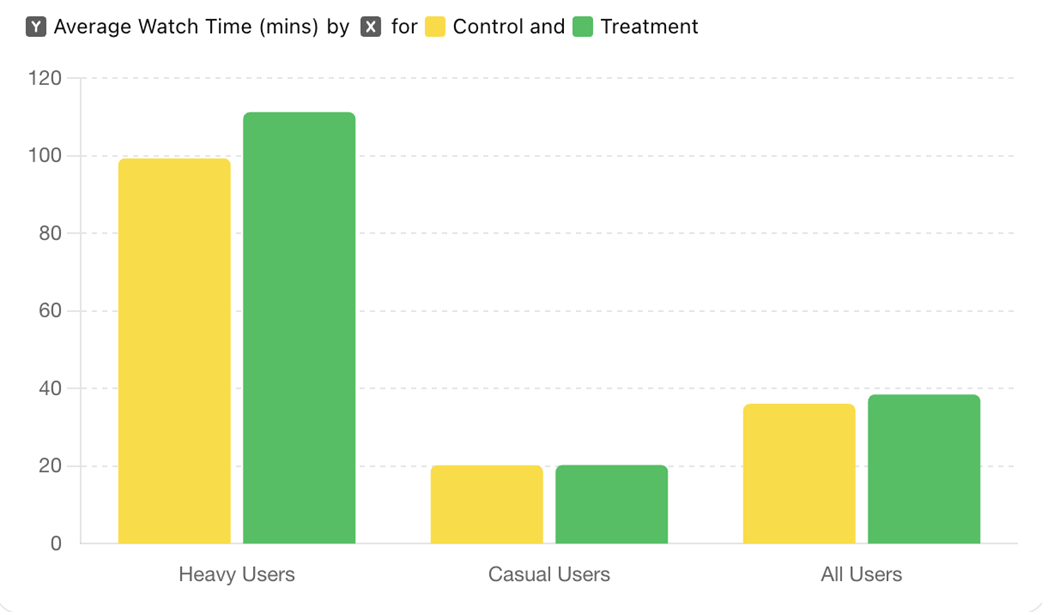
The figure contrasts the effect for heavy and casual users with the smaller top-line average. section 8.6.1
Listing 3.1 Analyzing Distribution of Genres by Age Group Cohorts
# Calculate the distribution of genres within each age group's recommendations
genre_diversity = analysis_df.groupby(['age_group', 'genre']).size().reset_index(name='count')
genre_pivot = genre_diversity.pivot(index='age_group', columns='genre', values='count').fillna(0)
genre_pivot = genre_pivot.div(genre_pivot.sum(axis=1), axis=0)  # Normalize by row to get proportions

genre_pivot
The listing groups recommendations by age and genre, then normalizes each age group's counts into proportions for comparison. section 3.1.1