How far are forecasts from actual demand, on average? Mean absolute error (MAE) measures forecast accuracy as the average absolute difference between each forecast and its corresponding actual value. Calculate each error as forecast minus demand, remove its sign with the absolute value, add those absolute errors, and divide by the number of periods. Because over- and under-forecasts are both counted as positive distances, they cannot cancel each other out. section 8.3
Four-period demand example
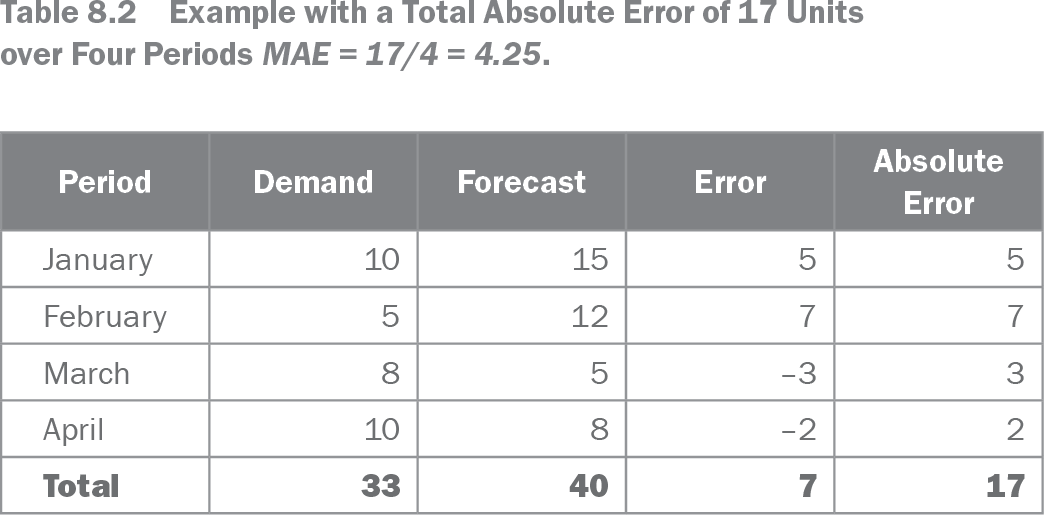
For January through April, absolute errors of 5, 7, 3, and 2 units total 17. Dividing 17 by four periods gives an MAE of 4.25 units. The signed errors total 7, but MAE focuses on the size of misses rather than their direction. section 8.3
Table 8.2 Example with a Total Absolute Error of 17 Units over Four Periods MAE = 17/4 = 4.25. (view table figure)
| Period |
Demand |
Forecast |
Error |
Absolute Error |
|---|---|---|---|---|
| January |
10 |
15 |
5 |
5 |
| February |
5 |
12 |
7 |
7 |
| March |
8 |
5 |
–3 |
3 |
| April |
10 |
8 |
–2 |
2 |
| Total |
33 |
40 |
7 |
17 |
Inspect demand, forecast, signed error, and absolute error side by side to see why absolute errors are summed before averaging. section 8.3
An MAE expressed only in units needs context. An MAE of 10 units is excellent against average demand of 1,000 units but poor against average demand of 1 unit. Scale it by dividing MAE by average demand to obtain MAE%. Compute that percentage from the overall MAE and overall average demand, rather than calculating a separate percentage for every period. section 8.3.1
MAE is useful, but its weighting and optimization behavior matter:
- Each unit of error receives equal weight. This makes MAE less reactive to extreme values than RMSE, while extreme values still affect it. section 9.1 section 9.3
- Minimizing MAE tends toward median demand, which can encourage under-forecasting when the median is below the average. section 8.3.3
- For intermittent demand, a repeated zero forecast can achieve a better MAE% despite being unhelpful for supply-chain decisions. section 9.2
- Pair MAE with bias to assess both typical error size and systematic over- or under-forecasting; present them separately when communicating with management. section 9.3 section 9.5
Use MAE as a clear, communicable accuracy measure, then judge it against the demand context rather than treating a percentage as universally good or bad. Forecast difficulty varies with demand complexity, granularity, industry conditions, and available planning insight. Track accuracy across the relevant forecasting horizon and, where products differ widely in price, consider value-weighted metrics alongside accuracy and bias measures. section 10.0 section 14.4.1 section 9.3