Mean absolute error (MAE) is the average absolute difference between predicted or imputed values and their reference values. Lower MAE means replacements or predictions are, on average, closer to the original or expected values. section 6.1.1 section 7.2.3
Use MAE when the practical question is how far estimates miss their true values in the target’s own units. It supports direct comparisons among imputation methods, baseline models, tuned models, and alternative modeling approaches. section 6.1.1 section 12.4
Choosing an imputation method
For Airbnb NYC continuous features, randomly remove 5% of values, impute them, and compare reconstructed values with the originals. A mean-based SimpleImputer has higher MAE than an IterativeImputer using random forests for every displayed feature, so the multivariate approach makes fewer replacement errors. Increasing iterations can improve estimates but takes longer. section 6.1.1
Diagnosing a price baseline
Cross-validation predictions from a linear regression baseline produce an MAE of 12,568.371 Yen, alongside R-squared and RMSE. Inspecting the prediction range, negative predictions, scatterplot, and outliers adds context: MAE signals substantial error, while diagnostics reveal underfitting and infeasible estimates. section 7.2.3
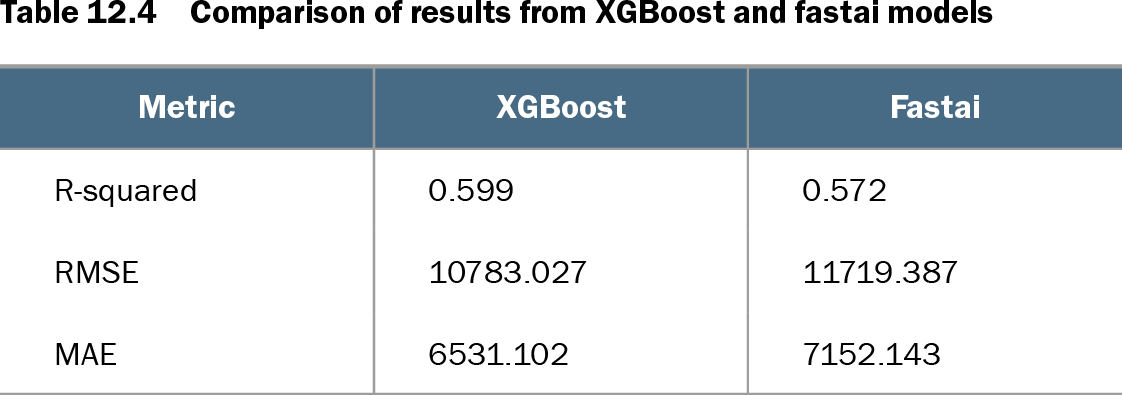
MAE can also be the optimization target. Hyperparameter trials for an XGBoost regressor are evaluated by cross-validation MAE, and the parameter set with the lowest result is selected. It then provides a common error scale for comparing XGBoost with fastai; the displayed XGBoost MAE is lower. section 7.2.5 section 12.4
Table 12.4 Comparison of results from XGBoost and fastai models (view table figure)
| Metric |
XGBoost |
Fastai |
|---|---|---|
| R-squared |
0.599 |
0.572 |
| RMSE |
10783.027 |
11719.387 |
| MAE |
6531.102 |
7152.143 |
Compare MAE with R-squared and RMSE for XGBoost and fastai on the same Tokyo Airbnb problem; lower MAE favors XGBoost in the displayed results. section 12.4