Mean squared error (MSE) measures the average squared difference between observed and predicted values. Squaring makes each error positive; averaging makes errors comparable across datasets with different numbers of points. section 3.4
Choosing an age cutoff
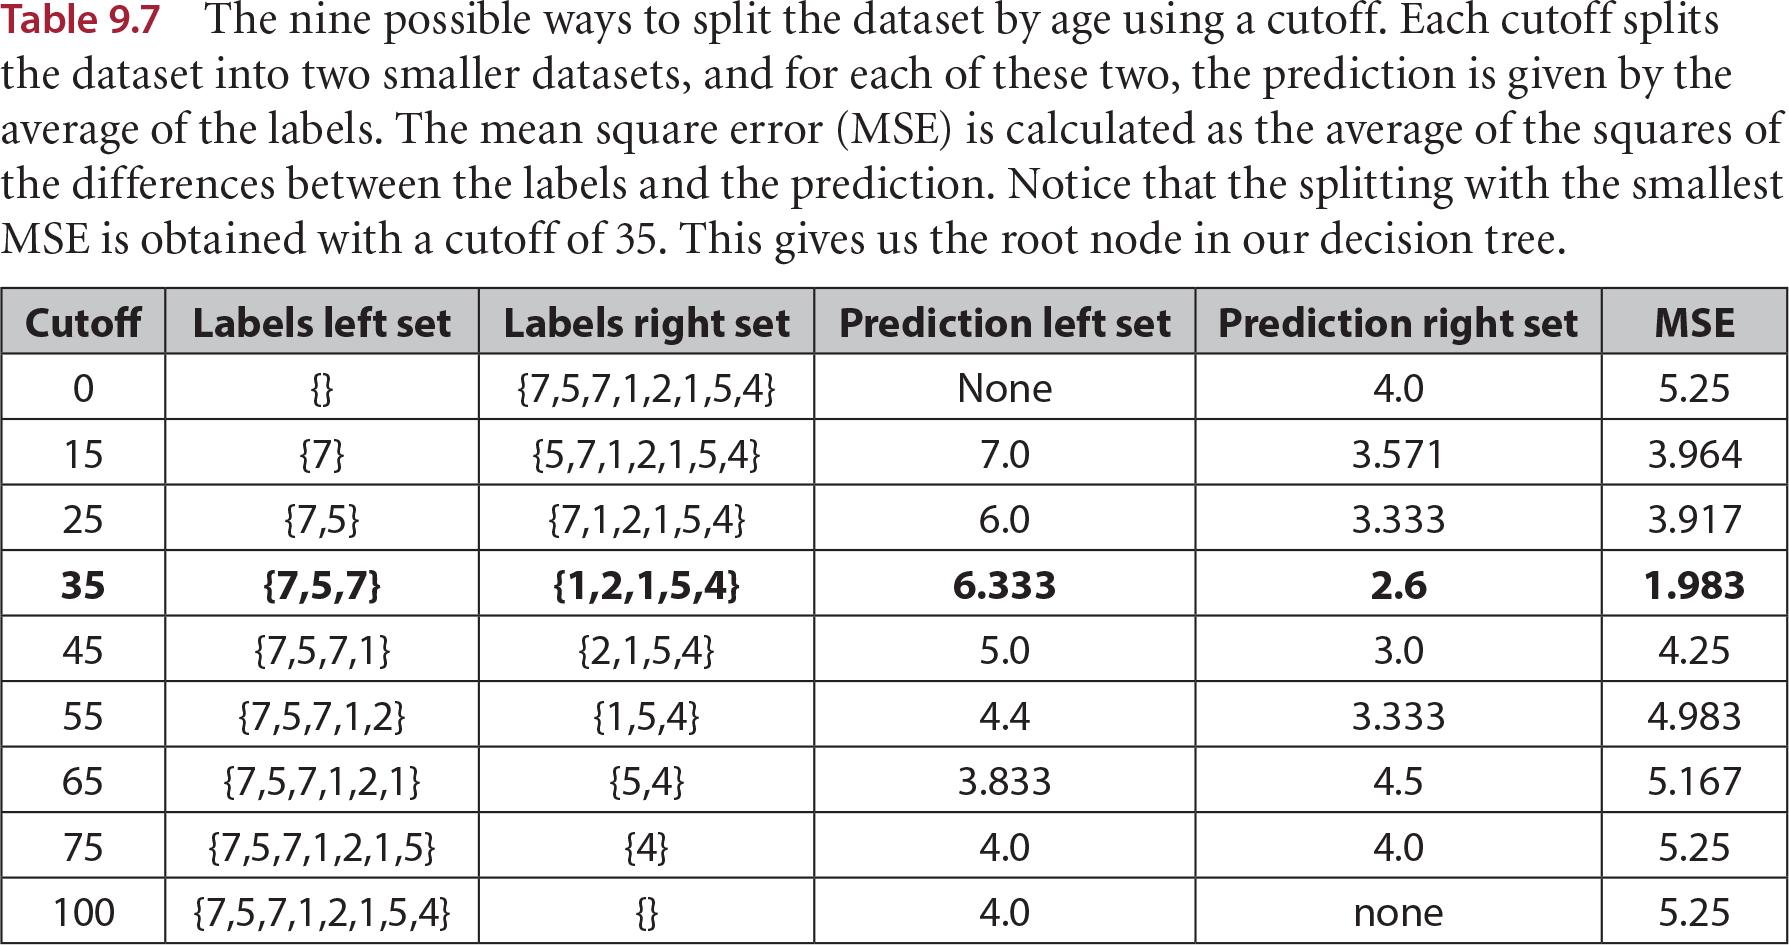
For a regression tree predicting app engagement from user age, a cutoff of 35 gives an MSE of 1.983, the smallest among the cutoffs shown. The tree uses MSE to choose its split. section 9.6
Table 9.7 The nine possible ways to split the dataset by age using a cutoff. Each cutoff splits the dataset into two smaller datasets, and for each of these two, the prediction is given by the average of the labels. The mean square error (MSE) is calculated as the average of the squares of the differences between the labels and the prediction. Notice that the splitting with the smallest MSE is obtained with a cutoff of 35. This gives us the root node in our decision tree. (view table figure)
| Cutoff |
Labels left set |
Labels right set |
Prediction left set |
Prediction right set |
MSE |
| 0 |
{} |
{7,5,7,1,2,1,5,4} |
None |
4.0 |
5.25 |
| 15 |
{7} |
{5,7,1,2,1,5,4} |
7.0 |
3.571 |
3.964 |
| 25 |
{7,5} |
{7,1,2,1,5,4} |
6.0 |
3.333 |
3.917 |
| 35 |
{7,5,7} |
{1,2,1,5,4} |
6.333 |
2.6 |
1.983 |
| 45 |
{7,5,7,1} |
{2,1,5,4} |
5.0 |
3.0 |
4.25 |
| 55 |
{7,5,7,1,2} |
{1,5,4} |
4.4 |
3.333 |
4.983 |
| 65 |
{7,5,7,1,2,1} |
{5,4} |
3.833 |
4.5 |
5.167 |
| 75 |
{7,5,7,1,2,1,5} |
{4} |
4.0 |
4.0 |
5.25 |
| 100 |
{7,5,7,1,2,1,5,4} |
{} |
4.0 |
none |
5.25 |
Compare the candidate age cutoffs, their group predictions, and their MSE values. section 9.6