OpenTelemetry is a vendor-agnostic collection of APIs, SDKs, specifications, protocol, and tools for instrumenting applications and collecting, processing, and ingesting telemetry. It covers traces, metrics, and logs, with profiles planned for future support. section 4.3 section 4.6
Its central workflow connects applications and infrastructure to a collector, where signal-specific pipelines can collect, process, filter, aggregate, downsample, redact, and route telemetry to backend destinations. This separation reduces reinstrumentation when destinations change. section 4.3 section 1.5.3
Use OpenTelemetry to:
- Standardize telemetry across cloud providers, on-premises environments, and observability backends. section 1.5.3 section 11.4.1
- Start with auto-instrumentation when supported, then add SDK-based manual instrumentation for business logic that automatic methods cannot capture. section 4.3.1 section 4.6
- Route traces and metrics, and eventually logs, from varied sources to destinations through the OpenTelemetry collector. section 4.6
- Correlate signals using resource attributes, signal attributes, and semantic conventions for common names and values. section 11.1.1
Instrumenting a service
For a service running in a Kubernetes environment, enable an OpenTelemetry language SDK or auto-instrumentation, configure a service name and exporters, send telemetry to collector pipelines, and preserve resource metadata such as cluster, region, pod, and service identity. HTTP metrics and traces can then be correlated in a backend. section 4.3.1 section 11.1.1
OpenTelemetry does not make instrumentation free: automatic instrumentation can affect application performance, while manual instrumentation requires additional work. Logs were still described as less mature than metrics and traces, so signal support and implementation status require verification. section 4.3.1 section 4.0
Figure 4.5 Concept of OpenTelemetry collection (from upstream docs; https://opentelemetry.io/docs/reference/specification/logs/overview/)
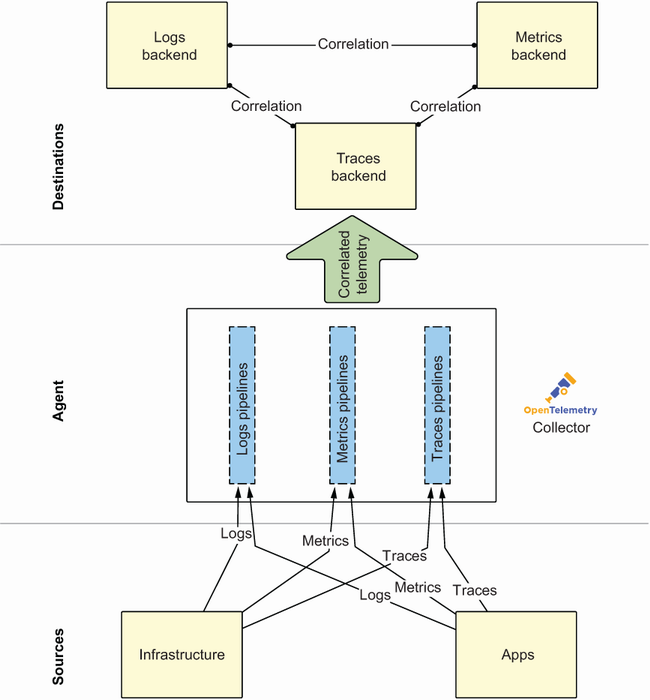
Follow the collection path from applications and infrastructure through the OpenTelemetry collector to backend destinations. section 4.3






