OpenTelemetry (OTel) is a vendor-neutral, language-agnostic collection of tools and APIs for collecting and exporting application telemetry. In a cloud-native Java application, its distributed tracing capabilities help follow a request across services and find where time is spent. Quarkus supports OpenTelemetry through MicroProfile Telemetry. section 10.4.1 section 10.7
A trace groups the operations involved in a request. Each operation is a span, and spans in one trace form a tree. A trace ID lets supporting services correlate their spans; HTTP can carry that tracing metadata in headers. Jaeger visualizes the resulting trace. section 10.4 section 10.8
Choose how to export the tracing data:
- Export OTLP data directly from applications to Jaeger for a simpler, smaller-scale setup. section 10.4.1
- Send OTLP data through an OpenTelemetry Collector for central processing before forwarding it to a backend. At larger scale, the collector can add filtering, batching, and retries. section 10.4.1
Following a database operation
A request that creates a product can include a database SELECT to obtain the next ID and an INSERT to save the definition. Their spans place those operations within the request’s trace, helping locate delays alongside work done by other services. section 10.4
Figure 10.9 OpenTelemetry tracing topology with OpenTelemetry Collector
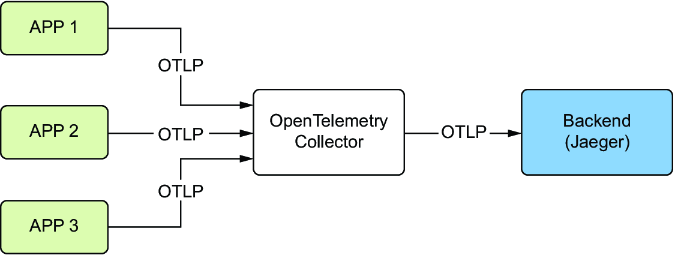
The collector topology shows applications exporting tracing data through a central collector before it reaches a backend. section 10.4.1
OpenTelemetry also encompasses metrics and logs, but the Quarkus support described here focuses on tracing: its metrics and logging capabilities were not considered ready and stable at the time. A separate collector is optional when the backend accepts OTLP directly. section 10.4.1






