OpenTelemetry (OTel) is an open-source, vendor-neutral observability framework for generating, collecting, and exporting telemetry. Its signals—logs, traces, and metrics—make API behavior easier to understand, diagnose, and monitor for threats. section 11.2 section 11.7
Use each signal for a different kind of operational question:
- Logs record individual events, such as incoming requests and raised errors. section 11.2
- Traces connect the processing steps and logs belonging to one request through a shared trace ID. section 11.2
- Metrics aggregate behavior, such as request counts and response latency, revealing unusual trends and endpoint-abuse patterns. section 11.6 section 11.7
Counting repeated calls to an endpoint
A FastAPI service can create an OTel meter and counter for GET /books, then increment the counter on each request. Comparing requests per minute with normal activity can reveal scraping or enumeration; investigate an alert before applying rate limiting. section 11.6
Figure 11.2 Every step in processing an API request may raise a log for our records. Without something to correlate the logs, it’s difficult to connect them all and get the full picture.
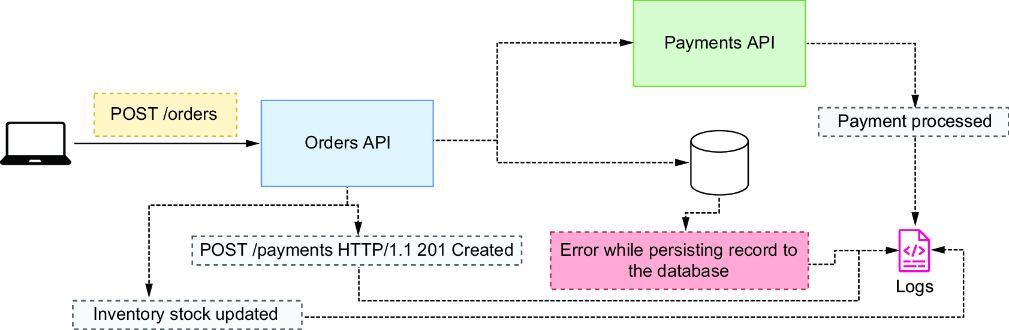
Use the figure to see why separate request logs are difficult to interpret without correlation, and why traces provide a fuller processing picture. section 11.2






