OpenTelemetry, or OTel, unifies observability data as logs, metrics, and traces. Its common protocols and formats let applications, collectors, and analysis tools exchange telemetry without requiring a custom adapter for every destination. section 1.3.2 section 5.1
OTel calls these data types signals. Logs record application events; metrics measure resource or business behavior; and traces follow a transaction across services. Traces contain spans for significant activities, which can nest to represent composed services or transactions. section 3.6.7
Use OTel data flows to make distributed operations easier to observe:
- Receive OTLP-compliant logs, metrics, and traces from applications over the network. section 3.1 section 3.6
- Route telemetry directly to an OTel-compliant collector, including a Fluent Bit instance, rather than passing application logs through files or container logging layers. section 4.6.1
- Correlate logs with metrics and traces around a shared service or subject, such as Pod performance, error rates, and application activity. section 5.10
- Transform collected events into OTel format, then forward them to downstream aggregation or analysis services. section 5.10
The OpenTelemetry Protocol (OTLP) defines telemetry data structures, encoding, and transmission. Fluent Bit can accept OTLP traffic and can also emit OTel-formatted data, making it useful at collection, consolidation, transformation, and routing points in a telemetry pipeline. section 1.3.2 section 5.10
Receive each OTel signal on a dedicated input
Configure three OpenTelemetry inputs: logs on port 4318, raw traces on 4317, and metrics on 4316. Send all matching events to stdout first to verify that each signal reaches Fluent Bit before routing it elsewhere. section 3.6.7
For containerized applications, SDKs can send logs through application APIs to an OTLP collector. Existing logging frameworks can instead use the Logs Bridge API to add appenders that forward their events to that collector. Direct routing helps associate logs with metrics and traces. section 4.6.1
When exporting, configure separate URIs for logs, traces, and metrics, plus labels that identify the producing application or client. JSON over HTTP(S) is usable for compatible endpoints; URI paths can be adjusted for proxies or nonstandard destinations. section 5.10
Figure 1.3 Fluent Bit’s relationship with OpenTelemetry with apps generating OTel logs, metrics, and traces and Fluent Bit facilitating their transmission to an OTel-compliant point of aggregation or processing. Applications can send OTLP data directly or via an OTel component, and we can route data to other OTel services or analysis tools.
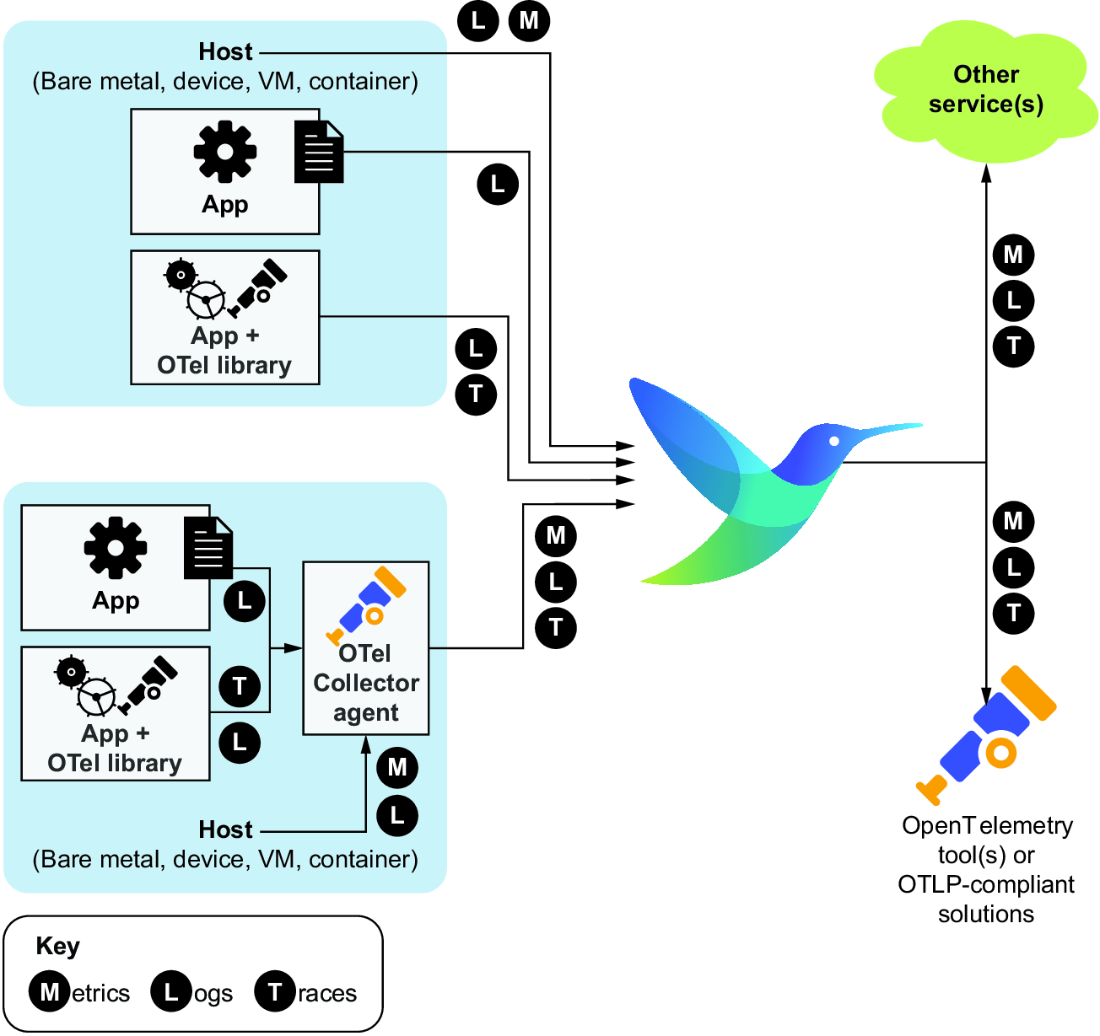
Follow the possible paths from OTel-producing applications through Fluent Bit to an OTel-compliant aggregation point or analysis tool. section 1.3.2
OTel adoption can be incremental. Fluent Bit’s alignment formalizes capabilities it already had for handling several telemetry types, while preserving interoperability with Fluentd and established monitoring tools such as Prometheus and Grafana. section 1.3.2 section 1.3
Protocol support has operational version consequences. Fluent Bit v1 and v2 supported OTLP’s HTTP and JSON path but not gRPC over HTTP/2; v3 adds HTTP/2 support. JSON remains a valid fallback where the endpoint accepts it. section 5.10






