OpenTelemetry is the observability layer that generates telemetry from running Java services, especially distributed traces composed of trace IDs and spans. It supports manual instrumentation in application code and automatic instrumentation through the OpenTelemetry Java agent, which attaches at startup without code changes. section 12.1.2
A practical tracing setup connects:
- Services instrumented with OpenTelemetry. section 12.1.2
- Export through protocols such as OTLP or gRPC. section 12.1.2
- Jaeger or Zipkin for collecting, searching, and visualizing traces. section 12.1.2
Figure 12.3 OpenTelemetry collects relevant data from the running service. Jaeger and Zipkin are tools that aggregate and display nicely this data to help you easily troubleshoot the system.
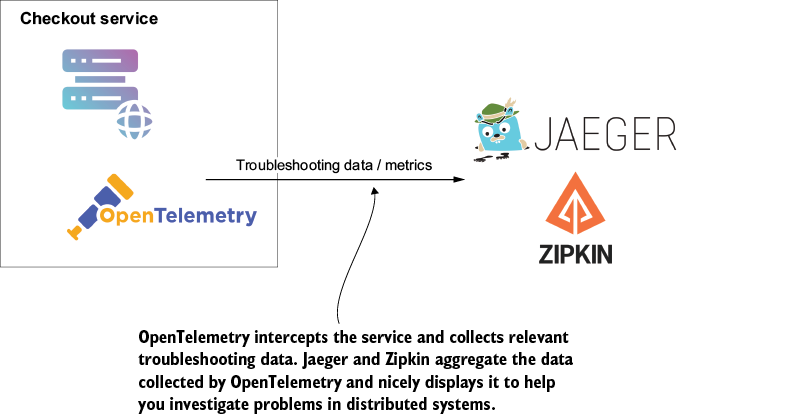
Use the architecture diagram to follow telemetry from a running service through OpenTelemetry to a tracing backend. section 12.1.2






