A sample may appear to show an improvement even when the underlying process has not changed. A p-value measures how unusual the observed result would be under a specified null hypothesis: p = P(result at least as extreme as observed | H₀). The meaning of “extreme” depends on the test and its direction. section 10.2.3 section 4.1.5
Compare p with a significance level α chosen before examining the results. If p ≤ α, reject H₀; otherwise, fail to reject it. The same decision can be expressed by checking whether the test statistic falls in a critical region. The significance level sets the tolerated probability of a Type I error: rejecting a true null hypothesis. section 4.1.5 section 10.2.3
Figure 4.1 Illustration of critical regions in a two-tailed hypothesis test at the 5% significance level. The curve represents the distribution of the test statistic under the null hypothesis. In a two-tailed test, the rejection regions are placed symmetrically in both extremes of the distribution, with 2.5% in each tail, so that results unusually far from the center in either direction would lead to rejecting the null. By contrast, a one-tailed test would place the entire 5% rejection region on only one side of the distribution, used when deviations are meaningful only in a single direction. This figure provides one example of how critical regions formalize the decision rule in hypothesis testing.
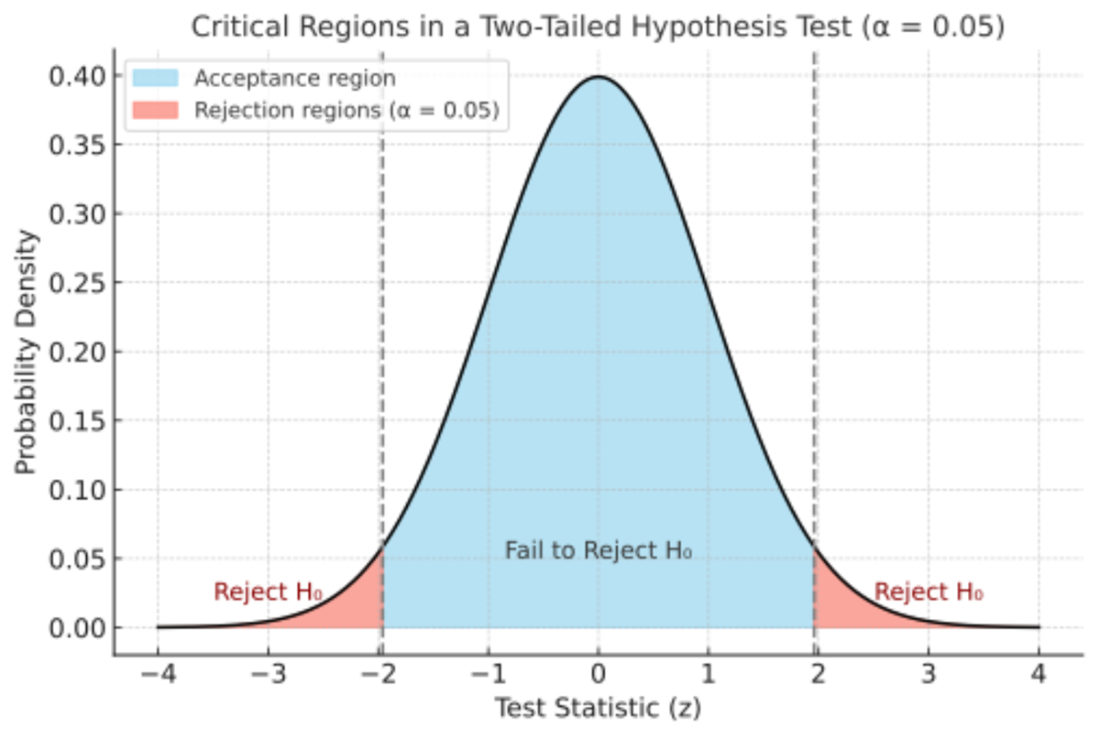
The figure shows how a 5% critical region is divided between two tails, or placed in one tail for a one-tailed test. section 4.1.5
A small clinical trial
With 20 patients and a null recovery probability of 50%, the predetermined rejection threshold is 15 recoveries. The trial records 14; the exact one-tailed p-value is approximately 0.057, the probability of 14 or more recoveries under H₀. Since 0.057 > 0.05, the researchers fail to reject H₀. This does not establish that the drug is ineffective or that H₀ is true. section 4.2.3
Beverage fill volumes
A sample of 20 containers gives a t-statistic of approximately −2.24 and a two-tailed p-value of approximately 0.037. At α = 0.05, the null hypothesis of the target average fill volume is rejected; the result justifies investigation or corrective action, not proof that the process is off target. section 4.2.1
A p-value is not the probability that the null hypothesis is true. Report its value alongside the decision: a binary label can obscure how close a result is to the threshold. Changing α after seeing the data, selectively reporting favorable results, or testing repeatedly until a result is significant can increase false discoveries. section 10.2.3 section 4.2.3








