The Poisson distribution models the number of events occurring within a fixed time period when the event's waiting time follows an exponential distribution. Its outcomes are discrete, begin at zero, and have no upper bound; probabilities taper as counts increase. section 2.3.1 section 2.1.8
Choose it by reasoning from the stochastic process that generated the population, rather than treating the distribution as an isolated formula. This connects canonical distributions to generative and causal modeling workflows. section 2.3.1
Use the distribution to:
- Visualize count probabilities with a bar plot, distinguishing the result from a histogram. section 2.1.8
- Compare a discrete Poisson distribution with a continuous normal approximation when their shapes overlap. section 2.1.8
- Generate samples inside probabilistic programs, including a Poisson latent variable in Pyro. section 2.3.1
Figure 2.12 A continuous normal distribution (solid line) approximates a discrete Poisson distribution (gray bars). Again, the outcomes are on the horizontal axis, and the probability values are on the vertical axis.
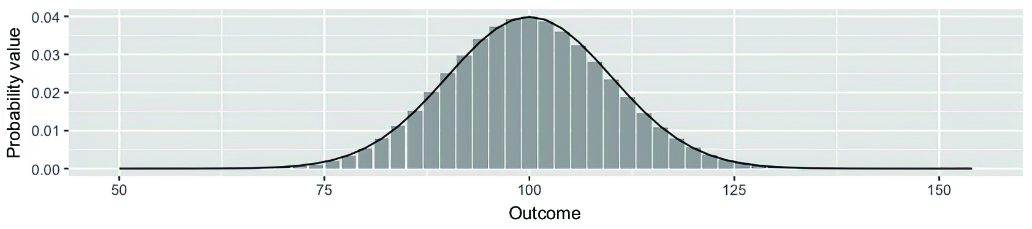
Compare the Poisson bars with a continuous normal curve to inspect how a count distribution can be approximated visually. section 2.1.8






