The Poisson distribution models event counts in a fixed interval when events occur independently at a constant average rate. It is useful when the target records discrete events rather than a continuous measurement, such as calls, customers, claims, or interruptions. section 4.3.4
Choose a Poisson-based approach when the prediction target represents:
- Rain events per year in climate modeling. section 4.3.4
- Call-center calls, restaurant customers, or insurance claims during a defined period. section 4.3.4
- Production interruption events per year in predictive maintenance. section 4.3.4
Generalized linear models select distributions according to the target. Poisson suits event counts, while Gamma suits cost or duration per event; Tweedie combines Poisson- and Gamma-like behavior for compound outcomes. A plain regression model remains possible, but matching the distribution to the target is generally preferred. section 4.3.4
Comparing distribution choices
A predictive-maintenance dataset can model interruption counts with Poisson, interruption duration with Gamma, and total interruption time with Tweedie. section 4.3.4
Figure 4.11 Comparing Poisson, Tweedie, and Gamma distributions at different mean values (mu) of the distribution
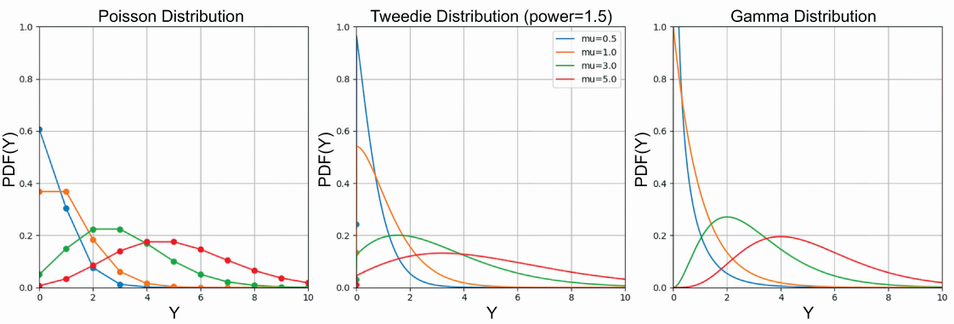
Compare Poisson, Tweedie, and Gamma distribution shapes across different mean values. section 4.3.4






