A precision-recall curve shows how a fraud classifier’s precision and recall change as its probability threshold moves. Convert predicted probabilities into binary fraud or genuine labels across thresholds from 0 to 1, calculate both metrics at each point, and plot precision against recall. section 1.6.4
Use the curve to make two practical evaluation decisions:
- Select an operating threshold by choosing the precision-recall combination that fits the application’s tolerance for missed fraud and false alarms. section 1.6.4
- Compare models without committing to one threshold by comparing the area under their precision-recall curves; the larger area indicates the stronger system. section 1.6.4 section 1.7
Setting a fraud threshold
For a fraud-detection model, inspect the PR curve and select the threshold that achieves maximum recall while maintaining at least 99.99% precision. Save that threshold with the trained model when deploying predictions. section 3.9
Figure 1.22 Precision-recall curve with hypothetical threshold values pointing to two different sets of precision and recall values.
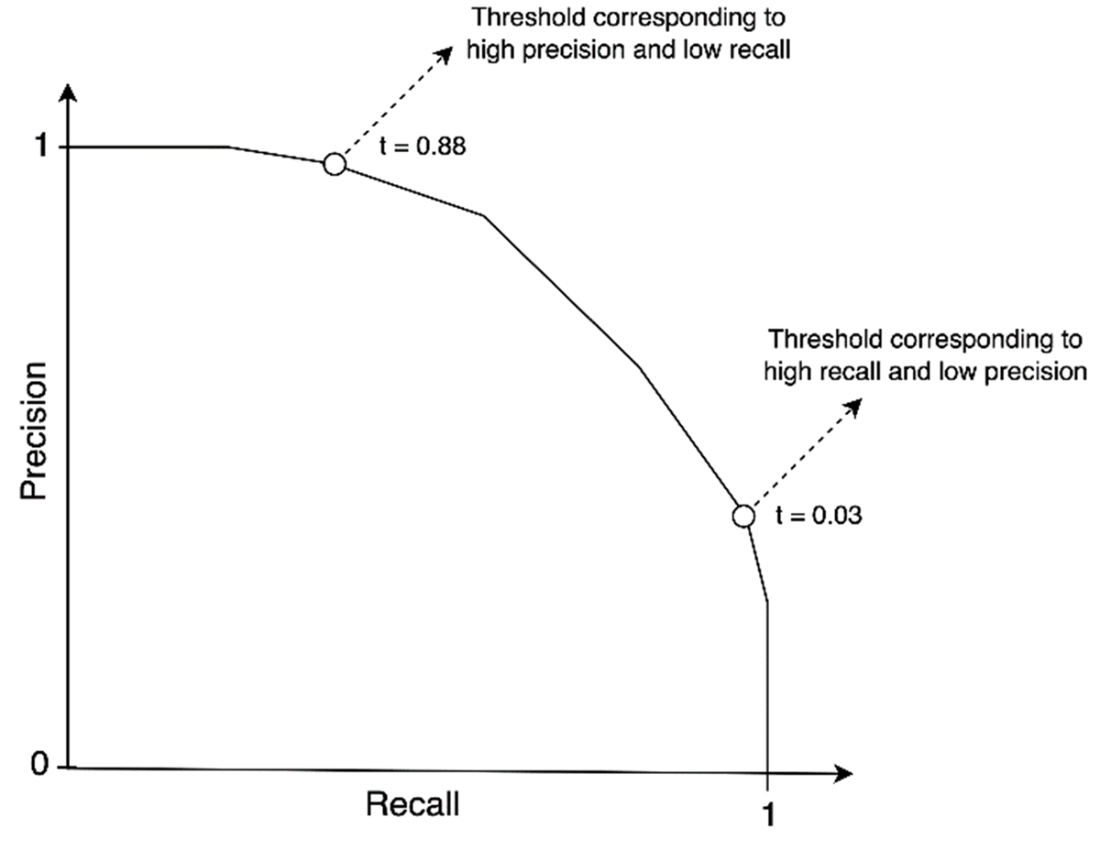
Use the threshold-labeled curve to connect alternative operating points with their corresponding precision and recall values. section 1.6.4




