A precision–recall curve evaluates a binary classifier across classification thresholds by plotting precision against recall. Each threshold changes the confusion-matrix counts and therefore produces a different point. section 5.2
Precision measures the fraction of predicted positives that are correct: TP/(TP + FP). Recall measures the fraction of actual positives detected: TP/(TP + FN). Averaging precision over recall values approximates the curve’s area. section 5.2
Threshold comparison
Adjusting a classifier’s threshold traces different precision–recall points. For a fixed threshold, the F1 score summarizes both measures as 2PR/(P + R), their harmonic mean. section 5.2
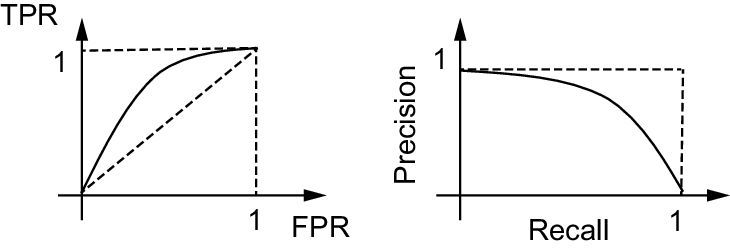
Compare the precision–recall plot with the receiver operating characteristic plot in the paired figure. section 5.2

