A precision-recall curve plots a classifier’s precision against its recall across decision thresholds. Each threshold creates a different confusion matrix, so the curve shows how the model trades false alarms for missed positives. section 8.10
Use the curve to compare threshold choices:
- Raising the threshold can increase precision while decreasing recall. section 8.10
- Prefer a precision-recall curve when the classes are imbalanced, such as when non-spam messages greatly outnumber spam. section 8.11
- Use area under the curve as a single-number summary, rather than relying only on accuracy. section 8.11
Predicting toddler meltdowns
A logistic regression predicts whether a toddler will have a meltdown based on hours without a nap. Testing many thresholds produces the precision-recall curve: a stricter threshold catches fewer meltdowns but makes fewer false alarms, while a looser threshold catches more meltdowns at the cost of more false alarms. A larger dataset makes the curve more informative than a tiny sample. section 8.10
Figure 8.9 The precision-recall curve (PRC) for our toddler meltdown dataset
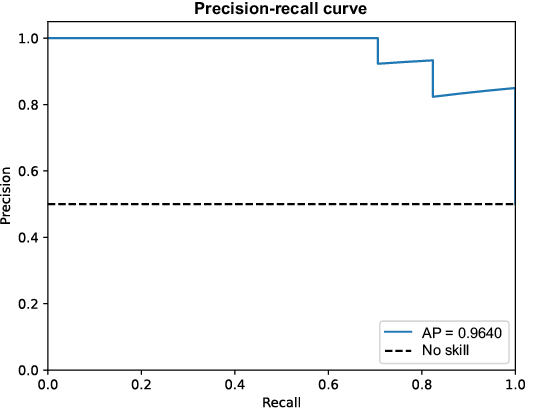
Inspect the precision-recall curve for the toddler meltdown dataset and connect its shape to threshold choices. section 8.10

