A default classification threshold can hide a costly tradeoff: catching more high-risk cases may also produce more false alarms. A precision-recall curve plots precision against recall across decision thresholds, helping compare those tradeoffs before choosing a cutoff. section 4.6.5 section 4.7
Recall asks how many actual high-risk cases the classifier finds. Precision asks how often its high-risk predictions are correct. Lowering the threshold can catch more cases but increase false positives; raising it can improve precision while missing real risks. section 4.6.5
Figure 4.11 Precision vs. Recall at Different Thresholds.
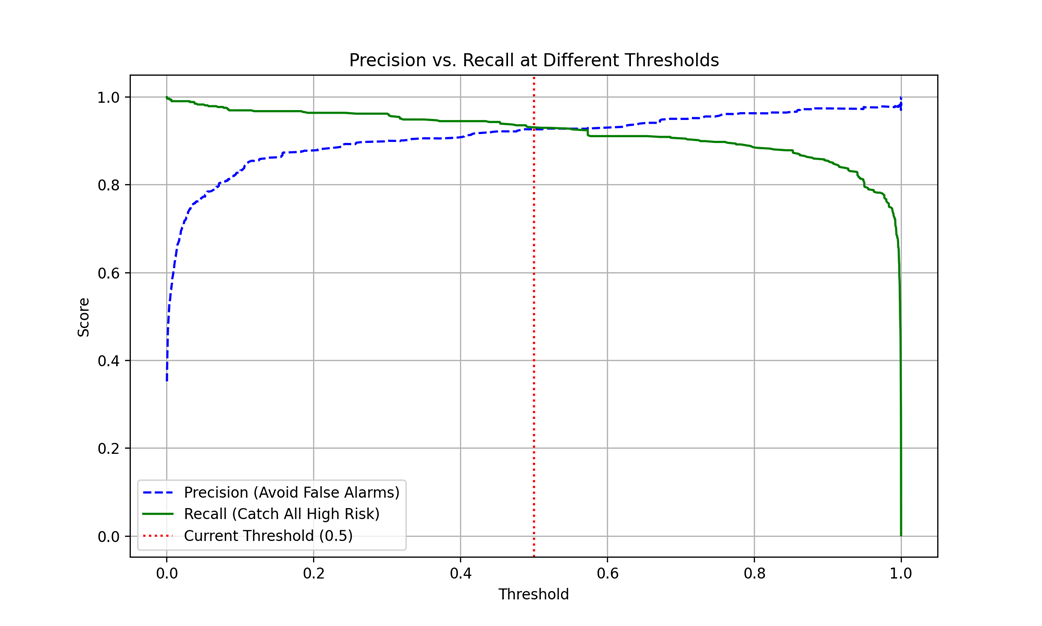
This figure plots precision and recall at different thresholds. Unlike a precision-recall curve, it makes the threshold itself visible on the plot. section 4.6.5
Choosing a risk threshold
For a high-risk versus low-risk classifier, a score of 0.55 is classified as low risk at a 0.6 cutoff. In one threshold plot, a cutoff just below 0.6 appeared promising because precision remained high before recall dropped sharply. Treat that visual choice as a hypothesis to test, not a universal optimum. section 4.6.5
Choose the tradeoff for the decision: prioritize recall when missed risks are especially costly, or weigh precision more heavily when false alarms matter. An LLM can help generate or interpret a visualization, but its suggested cutoff still needs experimental checks. section 4.6.5 section 4.7




