A probability density function (PDF) describes the relative likelihood of values taken by a continuous random variable. Its formula depends on the modeled distribution, and its curve shows density across possible values. section 2.3.2 section 3.1.1
A density value is not itself the probability of observing one exact continuous value. Probabilities come from the area under the curve across an interval, such as the range between standardized values 1.0 and 1.5. section 2.3.2 section 3.1.1
For a normal distribution, the PDF is determined by the mean μ and standard deviation σ. The curve is symmetric and bell-shaped, peaks at the mean, and becomes flatter and more dispersed as σ increases. section 3.1.1
Use the normal PDF computationally in two equivalent ways:
- Evaluate the formula directly with μ, σ, and a value z; for μ = 0, σ = 1, and z = 1, the density is approximately 0.24197. section 3.1.1
- Call scipy.stats.norm.pdf(z, loc=μ, scale=σ) for the same density, then use norm.cdf to obtain cumulative probability or subtract CDF values for an interval. section 3.1.1
- Generate normal samples with NumPy and compare observations within one, two, and three standard deviations of the mean. section 3.1.1
Standard normal density and interval area
For the standard normal distribution, μ = 0 and σ = 1. Evaluating the PDF at z = 1 gives 0.2419707245. The cumulative probability below z = 1 is about 84.13%; below z = 1.5 it is about 93.32%, so the probability between them is about 9.18%. section 3.1.1
Figure 2.2 The normal distribution illustrates where the interval, or range of possible values—which runs along the x axis—equals [2, 6]. The probability density, which runs along the y axis, peaks at the mean and typically tops out at approximately 0.399. The probability density for any value can therefore be estimated merely by observation. When the value equals 3.2, the probability density appears to be equal to approximately 0.30.
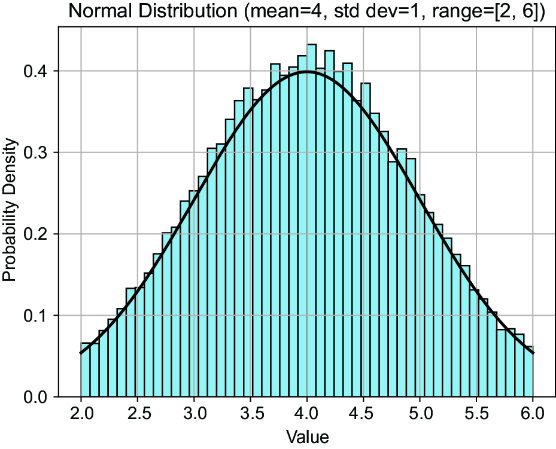
Inspect the normal curve for the interval [2, 6], where density peaks near the mean and is approximately 0.30 at 3.2. section 2.3.2





