liveBook · Manning

Prometheus

As explained in Cloud Observability in Action

Prometheus is an open-source monitoring system and time-series database for collecting and querying metrics.

Prometheus is the dominant metrics system in cloud-native environments, using an exposition format and pull-based collection: it queries instrumented applications or exporters over HTTP, usually at /metrics. section 4.2

Prometheus also evaluates alert conditions periodically with PromQL. When a rule fires, it sends the alert to Alertmanager, which deduplicates, groups, suppresses, and routes concise notifications to configured receivers. section 7.2.1

From metric to incident

A microservices operator notices an increased error rate on a Grafana dashboard built from Prometheus metrics. An exemplar supplies a trace ID, which leads to Jaeger traces and then service logs, allowing the operator to test whether a recent upgrade caused the problem. section 1.5.2
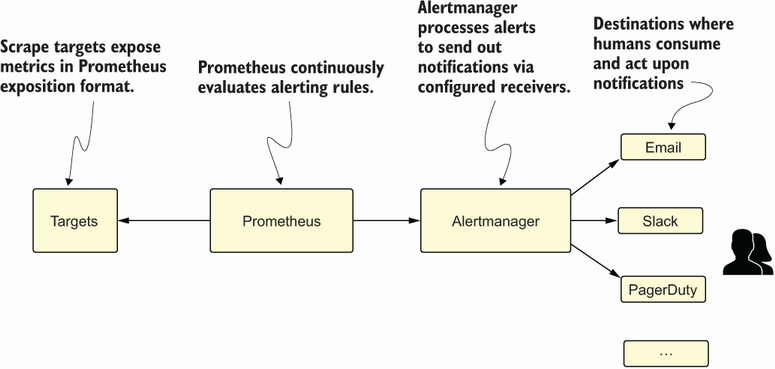
Figure 7.2 Prometheus and the Alertmanager

Use the architecture figure to follow the path from scraped targets through Prometheus and Alertmanager to operator notifications. section 7.2.1


How Cloud Observability in Action covers it

How deep it goes
Explains scraping, exposition, PromQL rules, Alertmanager routing, and signal correlation, with Docker-based configuration examples.
Examples
Uses /metrics endpoints, Node exporter targets, PromQL alert rules, Docker Compose services, and a microservices incident investigation.
What you can do after
Operate and configure metric scraping, PromQL alerts, Alertmanager routing, and cross-signal incident investigation.
How it connects
Connects metrics with Grafana, exemplars, distributed tracing, Jaeger, logs, exporters, and Alertmanager.

Also explained in

Compare how 8 books explain Prometheus →

Related concepts

This explainer was generated by Manning's knowledge graph from the text of Cloud Observability in Action. The section links point to the parts of the book it draws on.





