Prometheus is a time-series database for storing high-resolution metrics in an observability platform. It provides the metrics foundation for monitoring system performance and reliability. section 5.3.1
Use Prometheus as part of an observability and reliability workflow:
- Route metrics from an ingestion service into Prometheus while keeping collection, processing, and storage separate for scalability. section 5.3.1
- Persist metric data with block storage backed by Persistent Volume Claims so container restarts or migrations do not erase operational history. section 5.3.1
- Use Prometheus data to select service-level indicators, define objectives, visualize performance, and monitor error-budget consumption. section 5.4.1
Platform reliability scenario
An engineering platform can combine Prometheus with Grafana to expose service health and alert on emerging problems. At Epetech, teams used the combination to support SLOs and SLIs for critical services such as payment processing, enabling earlier detection and automated remediation. section 10.4.2 section 5.4.1
Figure 5.8 Most observability platforms, whether open source software or commercial, will use a similar high-level architecture. Specific technology components will be different depending on scale, but understanding this footprint will be important when considering build versus buy options.
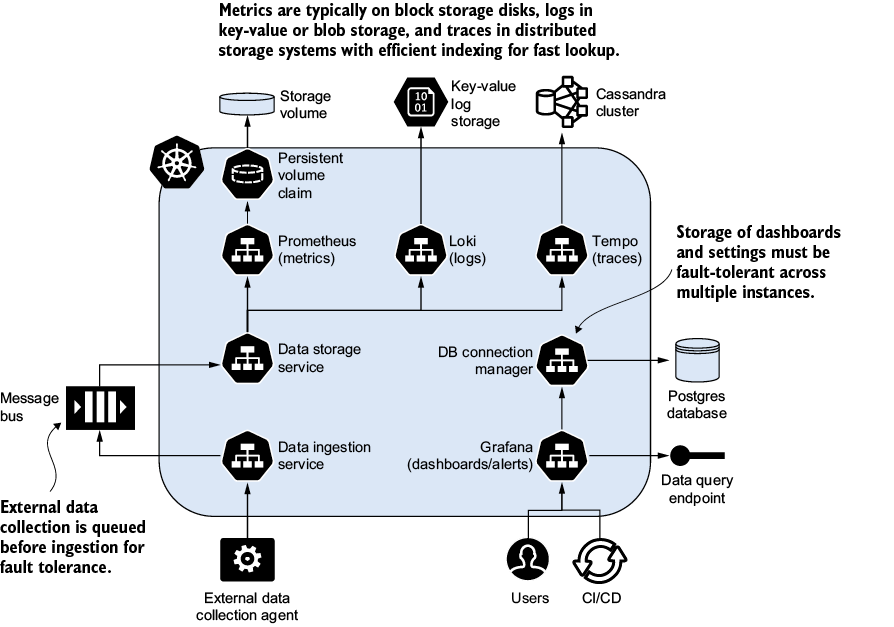
Use the observability-platform architecture to see where Prometheus fits alongside ingestion, storage, logs, traces, and visualization components. section 5.3.1







