Prometheus is a metrics aggregator for observing a ScyllaDB cluster over time. It periodically scrapes configured metrics endpoints, stores the results as time-series data, and lets you query the collected values through its web UI and PromQL. section 11.1.2 section 11.4
Configure Prometheus with the hosts it should scrape. In the Scylla monitoring stack, a targets file identifies the Scylla node and labels it with a cluster and datacenter; Prometheus then reads the designated endpoint on each target. section 11.1.1 section 11.4
Collected metrics answer operational questions such as:
- How slow are the worst 5% of reads, using 95th-percentile read latency? section 11.1.2
- How many reads are in progress when latency rises? section 11.1.2
- Have compactions increased compared with yesterday? section 11.1.2
Querying average read latency
A raw latency-sum metric can be aggregated across nodes with sum(...). Dividing the summed latency by the summed count produces an average: sum(scylla_storage_proxy_coordinator_read_latency_sum) / sum(scylla_storage_proxy_coordinator_read_latency_count). section 11.1.2
Prometheus is the monitoring backend for Grafana dashboards and the decision-maker for alerts. Grafana queries its metrics for visualizations, while Prometheus evaluates alerting rules against thresholds and sends firing alerts to Alertmanager for notification routing. section 11.1.3 section 11.1.4
Figure 11.1 Prometheus pulls metrics from your database nodes, which are used by the downstream components to provide visualizations and alert notifications.
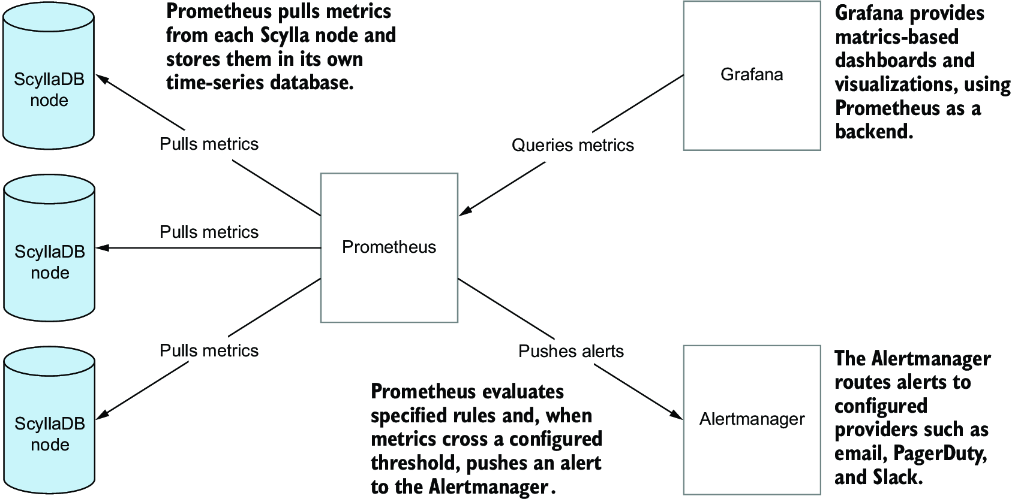
Trace the monitoring flow from database-node metric scraping through Prometheus to Grafana visualizations and alert notifications. section 11.1







