Kubernetes can scale pods using CPU and memory metrics, but it does not provide GPU metrics to its autoscaler out of the box. For an LLM service, GPU utilization or GPU memory utilization may be the more useful signal. Prometheus collects those metrics from a source such as NVIDIA’s DCGM exporter and stores them as queryable time-series data. section 6.2.2
Prometheus is a monitoring system, not an autoscaling controller. It can collect metrics from Kubernetes APIs and applications through exporters, agents, or sidecars. It also supports alerting and exposes an HTTP API that tools such as Grafana can query for dashboards. section 6.2.2
Figure 6.7 Autoscaling based on a custom metric like GPU utilization requires several extra tools to work, including NVIDIA’s DCGM, a monitoring system like Prometheus Operator, and a custom metrics API like that provided by KEDA.
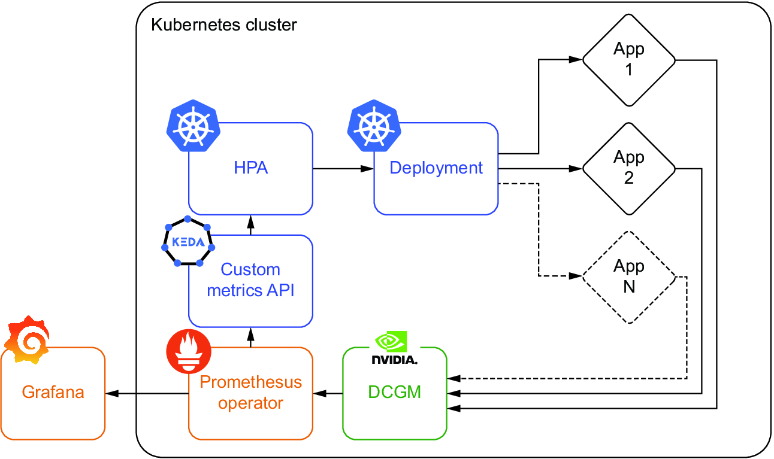
The diagram shows why GPU-based autoscaling needs more than a metric exporter: DCGM supplies GPU measurements, Prometheus handles monitoring, and a custom-metrics API makes the signal available for scaling. section 6.2.2
The operational catch is that storing a metric in Prometheus does not make it visible to Kubernetes’s horizontal pod autoscaler. An adapter must expose the metric through Kubernetes’s custom or external metrics API; KEDA is one option in this stack. Plan for that extra service when moving from dashboards to GPU-based scaling. section 6.2.2 section 6.5







