Reconstruction loss measures how poorly a model recreates an observation from a reduced or generated representation. In outlier detection, a large loss suggests that the observation does not follow patterns the model learned. It is an outlier score, not proof that the observation is meaningful or erroneous. section 16.2.1 section 6.9
The representation—and therefore the meaning of a high score—depends on the detector:
- PCA reconstructs a point using its first k components. PyOD’s PCA and KPCA detectors measure error as Euclidean distance to the hyperplane those components define. A point that fits the dominant pattern poorly receives a higher score. section 6.9 section 6.9.3
- An autoencoder compresses an input through an encoder, then uses a decoder to recreate it. Training seeks low reconstruction error; records that remain difficult to reconstruct can be flagged. section 16.2.1
- A variational autoencoder also uses reconstruction error, but learns a probabilistic latent representation and balances reconstruction with a well-formed latent space. A GAN-based detector can combine reconstruction error with a discriminator prediction. section 16.2.2 section 16.2.3
A point that breaks a relationship
Suppose two features usually rise together. A point can have ordinary values on each feature yet depart from that relationship. Its position may be described poorly by PCA’s first component, producing a large reconstruction error even though neither original value looks extreme. section 6.9
Prepare and test the detector rather than treating its score as universal. PCA is most useful when features are correlated, and obvious outliers can distort its fit; one PyOD workflow removes rows flagged by ECOD before fitting PCA. An autoencoder needs enough compression to expose unusual records: if it recreates nearly everything with zero error, it may have too much capacity. Compare autoencoders, VAEs, and other detectors using synthetic data or a pseudo-ground truth when appropriate. section 6.9 section 6.9.3 section 16.2.1 section 16.2.2
Figure 16.8 The left pane shows image 8 with random noise added. The right pane shows the reconstruction of this. Here the reconstruction error is high, and the image in the left pane is flagged as an outlier.
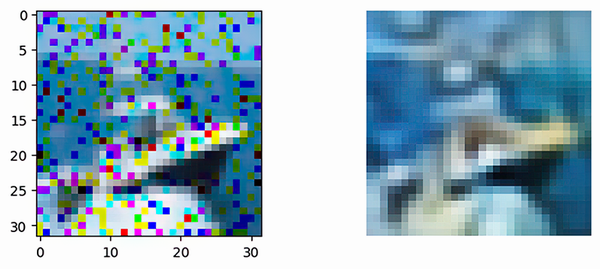
Compare the noisy boat image with its reconstruction: the visible mismatch illustrates why the altered image receives a high reconstruction error. section 16.4
For images, reconstruction is one option alongside generative methods, classifier confidence, feature modeling, and tests on perturbed images. Reconstruction loss can also be paired with another perspective: an autoencoder–Gaussian mixture model evaluates both reconstruction and the compressed representation. section 16.3.1 section 16.4









