liveBook · Manning

Entity-relationship diagram

As explained in Graph Neural Networks in Action

An entity-relationship diagram is a visual model showing entities, relationships, attributes, and constraints in a data or graph design.

An entity-relationship diagram (ER diagram) visually specifies a graph’s entities, relationships, and constraints. Use it to make graph structure explicit before parameterizing rules or experimenting in a GNN pipeline. section 8.2.2

Use an ER diagram to reason about:

  • Which node and edge types a graph contains, from homogeneous structures to heterogeneous datasets with multiple types. section 8.2.2
  • The rules and constraints that organize graph elements through a conceptual schema. section 8.2.2
  • How a conceptual schema can guide an instance model or later system-specific graph design. section 8.2.2
At left is the relationship nomenclature for ER diagrams. At right is an example of a conceptual schema using an ER diagram.
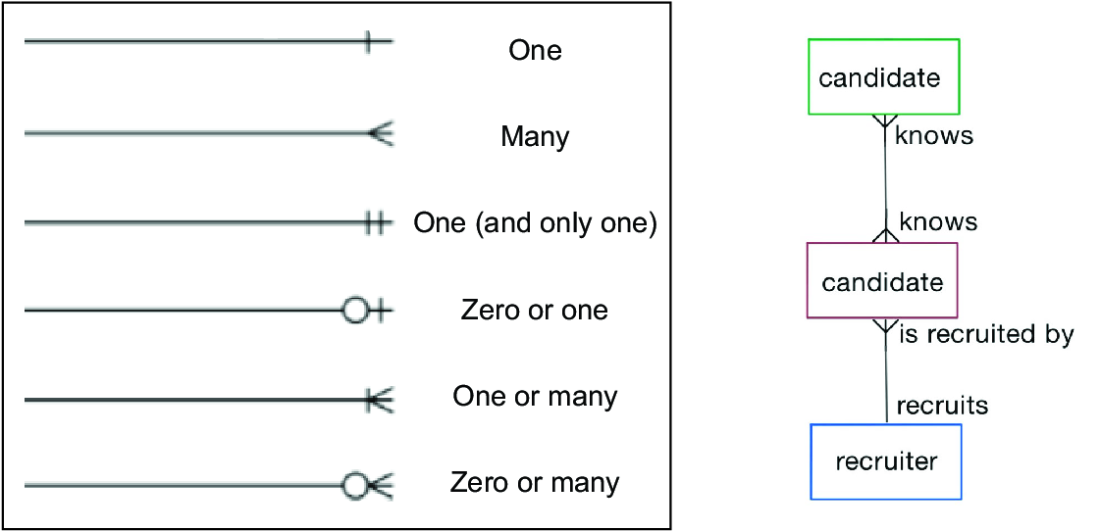
sidebar figure

Review relationship nomenclature alongside a conceptual-schema example to connect diagram symbols with graph structure. section 8.2.2

How Graph Neural Networks in Action covers it

How deep it goes
Defines the diagram and relates it to schemas, but defers detailed graph-data-model treatment to another reference.
Examples
Shows relationship nomenclature, a conceptual schema, and schemas containing one, two, or three node and edge types.
What you can do after
Build explicit graph structures and rules that support parameterized GNN experiments.
How it connects
Connects ER diagrams with graph datasets, schemas, instance models, ontologies, property graphs, RDF graphs, and heterogeneous graphs.

Also explained in

Compare how 4 books explain entity-relationship diagram →

Related concepts

This explainer was generated by Manning's knowledge graph from the text of Graph Neural Networks in Action. The section links point to the parts of the book it draws on.