A model can have a respectable overall score and still make costly mistakes on particular cases. A residual keeps those mistakes visible: for sample i, residual = predicted value − true value. A positive residual means overprediction; a negative one means underprediction. In regression this is a difference between numbers; more broadly, it is a sample-wise prediction error. section 9.2 section 9.2.5
Figure 9.8 Basic case: single regressor x. Each vertical line represents a residual error (e) or, simply, residual. Lines above the regressor have negative signs (the actual value is higher than the predicted value), and lines below the regressor have positive signs.
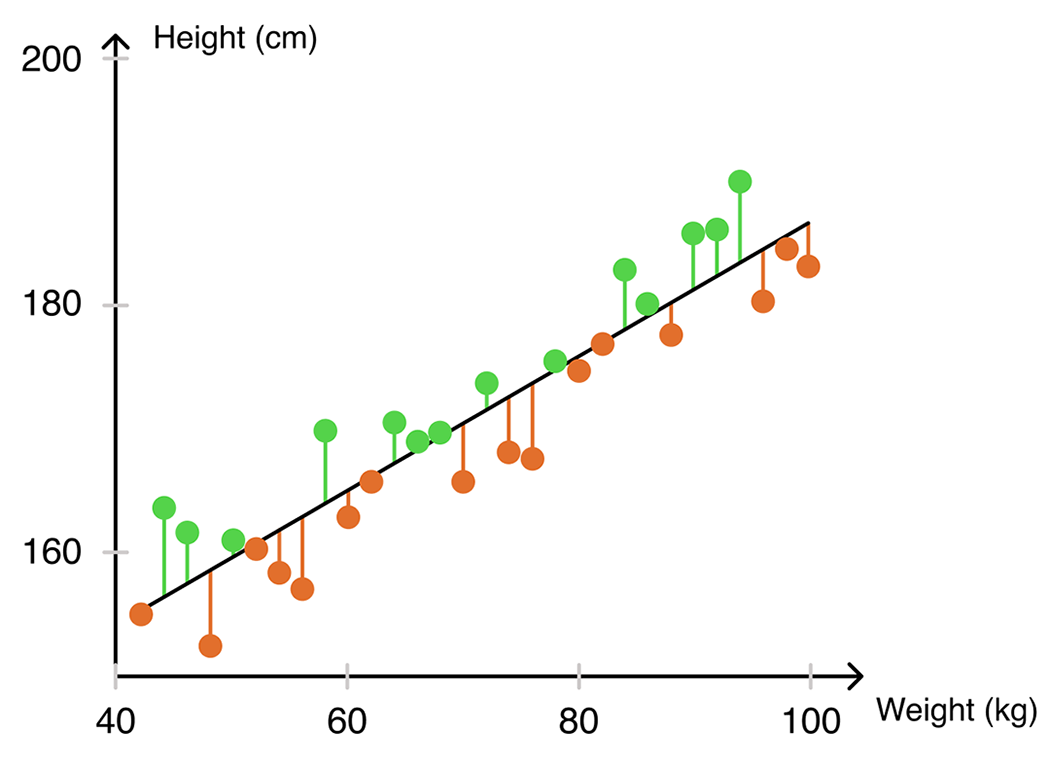
The vertical gaps show individual regression residuals. Points above the prediction line have negative residuals under the predicted-minus-actual convention. section 9.2
One outlier, two loss choices
Suppose nine true values are 100 and one is 1,000, while every sample has identical inputs. Predicting 190 for all ten cases gives MSE 72,900 and MAE 162; predicting 100 gives MSE 81,000 and MAE 90. The choice is not just about the better score: an exceptionally large miss may be unacceptable for aircraft navigation, while another application may tolerate rare large errors. section 5.1
Once the model has converged and underfitting or overfitting has been checked, use residuals to investigate what an aggregate metric hides:
- Inspect their distribution and diagnostic plots. For linear regression, check for bias, nonconstant variance, departures from normality, and patterns against fitted values. section 9.2 section 9.2.2
- Compare subsets and cohorts, then inspect the largest and smallest residuals and relevant corner cases. Ask which samples change when the model or its metric changes. section 9.2.1
- Separate overprediction from underprediction when their business costs differ. Demand forecasting may favor moderate overstock over missed profit; creditworthiness prediction may favor underestimation. section 9.2.5
Turning large errors into decisions
After a marketplace deployed demand-based dynamic pricing, inspection of the 200 products with the largest residuals exposed distinct problems. New products lacked sales history and needed a fallback heuristic; sparse-selling electronics were excluded from the pilot. Large underpredictions around promotions led to a promotional-calendar feature. The useful result was not merely a list of errors, but a different response for each failure pattern. section 9.3.1
For other tasks, the same diagnostic idea needs a task-appropriate error: search ranking can compare predicted and true ranks, while image segmentation can compare predicted and ground-truth masks. A term from the chosen loss can also serve as a pseudo-residual when a raw difference does not capture the error of interest. section 9.2










