liveBook · Manning

Scatter plot

As explained in Delivering Machine Learning Projects: From design to deployment

A scatter plot is a graph that represents paired observations as points on coordinate axes.

A scatter plot displays paired observations as points on coordinate axes. Use it in exploratory data analysis to see relationships that summary statistics can conceal. section 6.1.3

Use scatter plots to:

  • Compare how two variables relate across their ranges. section 6.1.3
  • Expose clustering, gaps, outliers, and uneven dispersal that aggregate measures may hide. section 6.1.3
  • Check whether random sampling may miss important parts of a relationship before modeling. section 6.1.3

Anscombe’s Quartet and tips versus bills

Anscombe’s Quartet shows that datasets can share means and Pearson correlation while having different plotted structures. Tips-versus-bills data reveals substantial dispersal rather than a uniformly linear relationship. section 6.1.3 section 6.1.3

Figure 6.1 Anscombe’s Quartet. Anscombe.svg: Schutz (label using subscripts): Avenue, CC BY-SA 3.0 (https://creativecommons.org/licenses/by-sa/3.0), via Wikimedia Commons
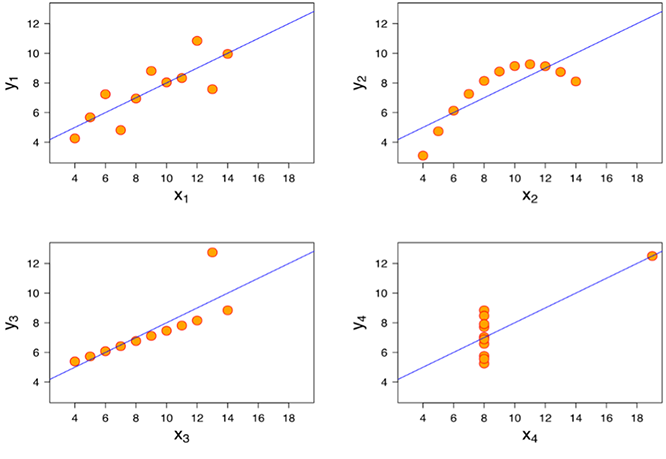
Inspect the four plots side by side to compare identical summary values with visibly different data relationships. section 6.1.3


How Delivering Machine Learning Projects: From design to deployment covers it

How deep it goes
Explains visual inspection and sampling implications, but stops short of plotting mechanics or statistical derivation.
Examples
Uses Anscombe’s Quartet and restaurant tips-versus-bills data to expose differing relationships and dispersal.
What it assumes
Builds from summary statistics toward visual inspection of paired data and assumes basic familiarity with datasets.
What you can do after
Evaluate data relationships visually, detect misleading summaries and uneven dispersal, and improve sampling decisions for modeling.
How it connects
Connects exploratory data analysis, summary statistics, correlation, covariance, sampling, and modeling.

Also explained in

Compare how 8 books explain scatter plot →

Related concepts

This explainer was generated by Manning's knowledge graph from the text of Delivering Machine Learning Projects: From design to deployment. The section links point to the parts of the book it draws on.