A scatter plot represents paired observations as points on a two-dimensional plane, making relationships between two numeric variables visible. It supports pattern detection, relationship assessment, outlier identification, and evaluation of linear-model fit. section 4.1.1
Read a scatter plot by examining:
- The horizontal axis for the independent variable and the vertical axis for the dependent variable; this orientation is conventional rather than mathematically required. section 4.1.1
- The direction and form of the relationship: points may show positive, negative, or nearly neutral association. section 4.1.1
- The distance of observations from a fitted regression line, which helps reveal unusual points and assess model fit. section 4.1.3
Eight paired observations
Plotting the pairs (152, 191), (175, 235), (179, 214), (222, 274), (202, 288), (221, 269), (239, 315), and (164, 201) shows observed x–y values alongside a fitted regression line. The point (202, 288) is highlighted as a possible outlier. section 4.1.1 section 4.1.3
Figure 4.1 A scatter plot that displays eight data points, their respective x and y coordinates, and a regression line. The data points represent the observed data (for instance, when x equals 202, y equals 288, which has been highlighted and magnified). The regression line ties back to a simple linear regression that was fit on the data, where a response variable called y, which runs along the y axis, was regressed against a predictor called x, which runs along the x axis. It represents the linear equation at the top that can be derived from the model output, which is to say, it is also a representation of the predictions for y given x. R-squared is one of several metrics contained in the model output; it represents the percentage of variance in the response variable that can be explained by changes in the predictor.
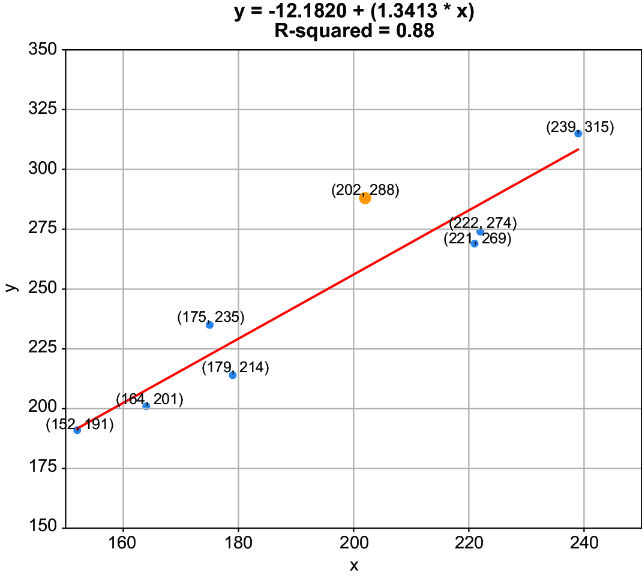
Use the annotated figure to connect individual observations, their coordinates, the fitted line, predictions, and R-squared. section 4.1.1