Self-service analytics lets stakeholders answer recurring data questions without waiting for an analyst each time. Analysts prepare resources—often interactive reports and dashboards—that people can filter, group, and explore for their own decisions. This can reduce routine requests and leave analytics teams more time for complex work. section 12.3 section 12.5
Choose the form of self-service to match the people and questions involved:
- For stakeholders who need familiar comparisons, provide dashboards with useful filters, such as subscription type or customer location. Revisit the filters when follow-up questions reveal gaps. section 12.3.1
- For colleagues who know some SQL, provide curated, pre-aggregated tables so common questions require simpler queries and less repeated metric calculation. section 12.3.1
- Make resources discoverable. A searchable library can preserve previous analyses, while a data catalog can explain available tables, columns, lineage, and example queries. section 12.2.2 section 11.3.3
Turn a repeated request into a reusable report
Suppose colleagues repeatedly ask for average purchase prices for particular cities. Instead of preparing each comparison separately, create a report with standard aggregate metrics across the relevant categories and let colleagues select the groups they need. A similar change turns a dashboard for one customer into a dashboard with a customer filter. section 12.2.2
Start a strategy by reviewing recent requests for repeated questions and identifying the comparisons people use to make decisions. Account for stakeholders’ comfort with data and the team’s capacity to support them. Ask intended users to test the resources, then add guidance on both operation and interpretation. Put links and instructions where people already look for information, and keep updating the resources as needs change. Independent access is most useful when people can find the right resource and understand its results. section 12.3.2 section 11.3.3
Figure 12.8 Creating self-service tools involves routinely evaluating requests, creating or updating resources, and circulating the updates to your stakeholders.
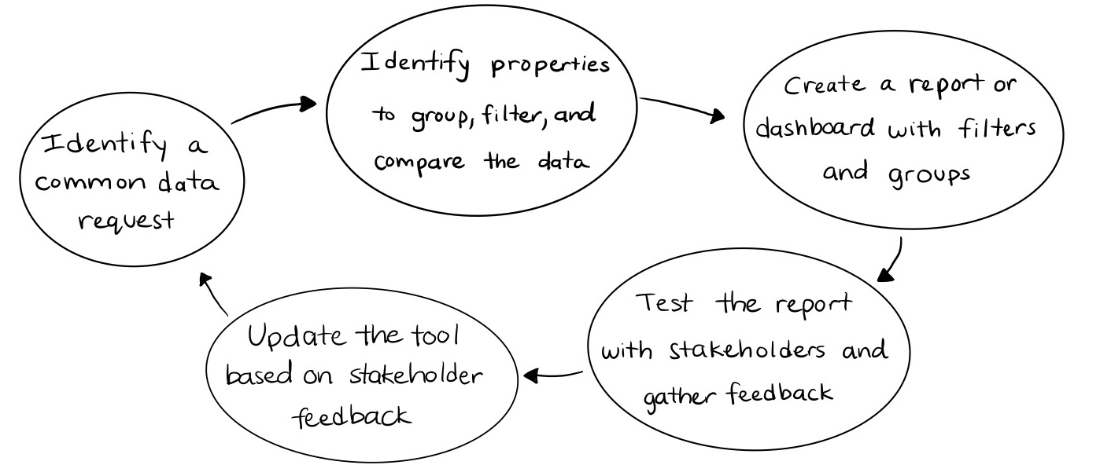
The figure summarizes the ongoing cycle: evaluate requests, create or update resources, and circulate changes to stakeholders. section 12.3.2