Sensor data consists of measured values produced while monitoring physical conditions or processes. Industrial systems commonly collect readings such as temperature and pressure at regular time intervals, often from many sensors. section 1.1.5
Outlier detection uses these readings to identify deviations when failure examples are scarce. An unusual value may indicate a process problem or a sensor data artifact, so flagged readings require interpretation rather than automatic escalation. section 1.1.5
Useful anomaly perspectives include:
- Point anomalies: single readings that are unusually high or low. section 1.1.5
- Contextual anomalies: readings that become unusual relative to other sensors or previous readings from the same sensor. section 1.1.5
- Collective anomalies: unusual combinations or changing associations across multiple readings or sensors. section 1.1.5
Figure 1.1 Temperature readings from sensor data presented as a time series. The x-axis tracks time in seconds and the y-axis tracks the temperature. There is an unusually high level of fluctuation at 200 seconds and an usually low level at 800 seconds.
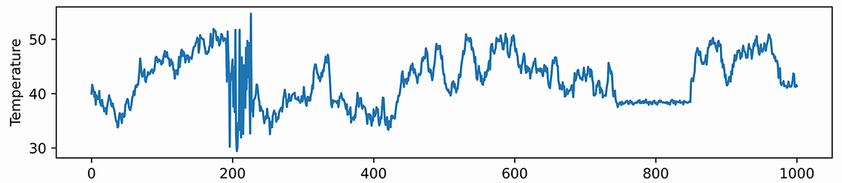
A time-series view makes isolated extremes and periods of unusual fluctuation visible across the measurement timeline. section 1.1.5
