A stakeholder is the person or group requesting a visualization and calling the shots on it. They commonly make the final judgment about whether the project succeeds. A stakeholder may also use the finished dashboard, but need not: users are the people who actually work with it. section 8.2
Meet stakeholders early to turn an initial request into confirmed requirements: what is being built, why it matters, and whether that understanding is correct. Ask them to point toward the relevant data and the people who control access, while remembering that they may know only its rough location. section 8.2 section 8.2.2
Figure 8.2 Sometimes your stakeholder, the person asking for the viz, is asking on behalf of others, and sometimes they’re going to be a user of the dashboard, too.
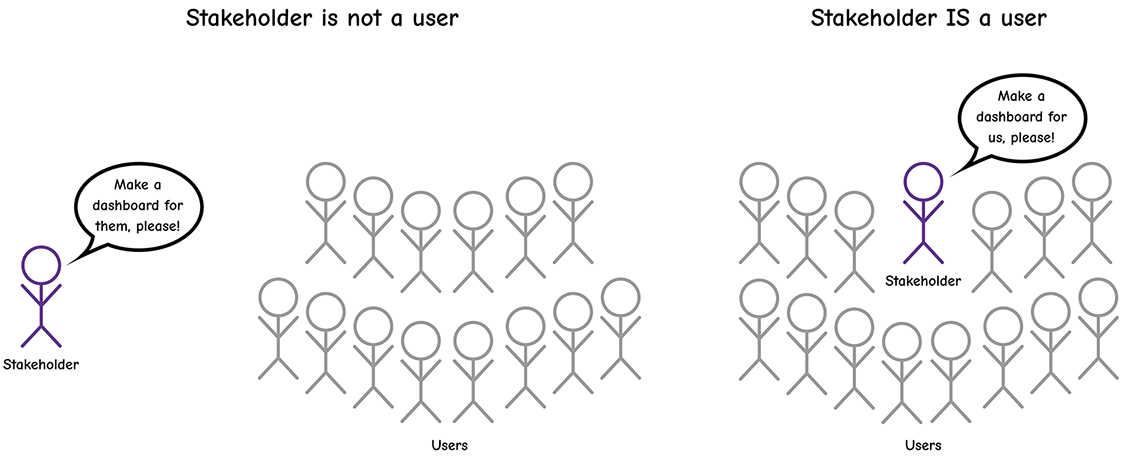
A requester and a user can be the same person, or the requester can be acting for a separate group of users. That small distinction changes whose needs need direct investigation. section 8.2
Keep stakeholder involvement useful rather than chaotic:
- Seek feedback throughout design and development, including on unfinished work. Early course corrections are far cheaper than discovering a mismatch after the dashboard is complete. section 8.4.2
- When a requested design clashes with sound visualization judgment, first uncover the underlying goal. Offer a viable alternative; if needed, present the requested option alongside the alternative so the stakeholder can choose. section 9.2
- Avoid letting data gathering, data modeling, and design race ahead independently. Check data access, availability, structure, updates, required measures, and security early enough to keep the work aligned. section 8.2.2
- Establish who can decide and approve. Too many voices can produce contradictory changes and slow sign-off; too little guidance can leave the work drifting without decisions. section 9.3.2
A dashboard requested on someone else’s behalf
A manager may commission a customer-facing dashboard without being a dashboard user. The development process still includes the manager, but it takes extra legwork to learn directly from the customers who will use the result. Conversely, a manager requesting a dashboard for their own team may be both stakeholder and user. section 8.2
Stakeholder preferences deserve attention, including preferences about fonts, colors, and polish. When those details matter greatly, a high-fidelity mockup can secure approval before development makes changes more expensive. section 8.3.3