Twenty timings are not one timing
Suppose 20 runs take between 0.1 and 1.3 seconds. Their mean is 0.6 seconds, but their standard deviation is 0.31 seconds: 52% of the mean. Reporting only the average would hide substantial variation. These fictive timings are too scattered to support a confident performance claim. section 15.3
TAKEAWAY: Repeat a timing experiment and report both its typical result and its spread. The number of runs, mean, standard deviation, and sometimes skew summarize what happened. A large standard deviation may reflect a disturbed computation, an unreliable measurement, or both; it does not identify the cause by itself. section 15.3
Figure 15.1. Frequency histogram for our sample, showing the frequency with which each of the measured values was obtained
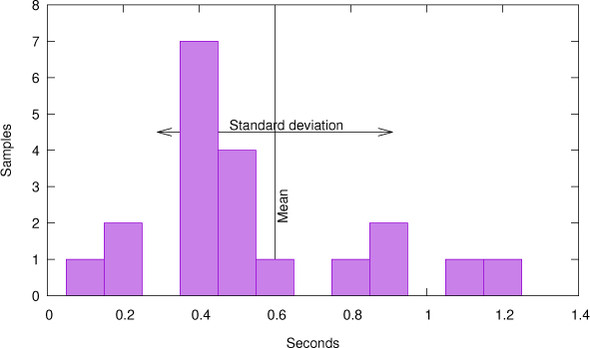
The frequency histogram makes the spread of the 20 measured timings visible alongside their mean. section 15.3
In C, a measurement loop can take timestamps around several code snippets, compute each elapsed time with timespec_diff, and pass it to stats_collect2. It can then print stats_mean and stats_rsdev_unbiased for each snippet. The reported percentage expresses variation relative to the mean; the mean divided by the iteration count gives a per-iteration figure. section 15.3
Listing 15.2. Collecting time statistics with timespec_diff and stats_collect2
102      for (unsigned i = 0; i < loops; i++) {
103        double diff = timespec_diff(&t[i+1], &t[i]);
104         stats_collect2(&statistic[i], diff);
105      }


!@%STYLE%@!
{"css":"{\"css\": \"font-weight: bold;\"}","target":"[[{\"line\":0,\"ch\":0},{\"line\":0,\"ch\":3}],[{\"line\":0,\"ch\":9},{\"line\":0,\"ch\":12}],[{\"line\":0,\"ch\":14},{\"line\":0,\"ch\":22}],[{\"line\":1,\"ch\":0},{\"line\":1,\"ch\":3}],[{\"line\":1,\"ch\":11},{\"line\":1,\"ch\":17}],[{\"line\":2,\"ch\":0},{\"line\":2,\"ch\":3}],[{\"line\":3,\"ch\":0},{\"line\":3,\"ch\":3}]]"}
!@%STYLE%@!
The collection loop shows where each elapsed time enters its statistic. section 15.3
Timing is itself an intervention: instrumentation changes compile-time and runtime properties. Even a timing call may affect scheduling or caches. Compare measured differences with their variability, and account for the cost of collecting statistics rather than assuming the measurement is free. In one comparison, a 6% difference is marked inconclusive, while larger measured changes are marked conclusive. section 15.3 section 15.4




