Statistical methods identify unusual values by describing a data distribution with measures such as standard deviation, interquartile range, or median absolute deviation. They usually examine one numeric column at a time, making them easy to understand and useful for finding extreme values before applying more sophisticated detection. section 2.0 section 2.9
Common statistical approaches include:
- Use z-scores to measure distance from a mean in standard-deviation units, especially when a roughly Gaussian distribution is plausible. section 2.0 section 2.9
- Use IQR, IDR, or MAD-based rules to identify values that depart from robust distribution summaries. section 2.9
- Use histograms, kernel density estimation, or kth-nearest-neighbor measurements to find internal outliers and handle asymmetric or multimodal distributions. section 2.9
- Score categorical values by frequency, using cumulative counts to help choose thresholds. section 2.9
A practical workflow begins by checking each column for extreme values, setting aside known extremes when they overwhelm the rest, and then deciding whether further detection is necessary. Statistical scores remain interpretive: flagged values may be noise, global outliers, local outliers, or meaningful observations. Combining separate column tests into one row-level score is difficult and can be subjective. section 2.0 section 2.9
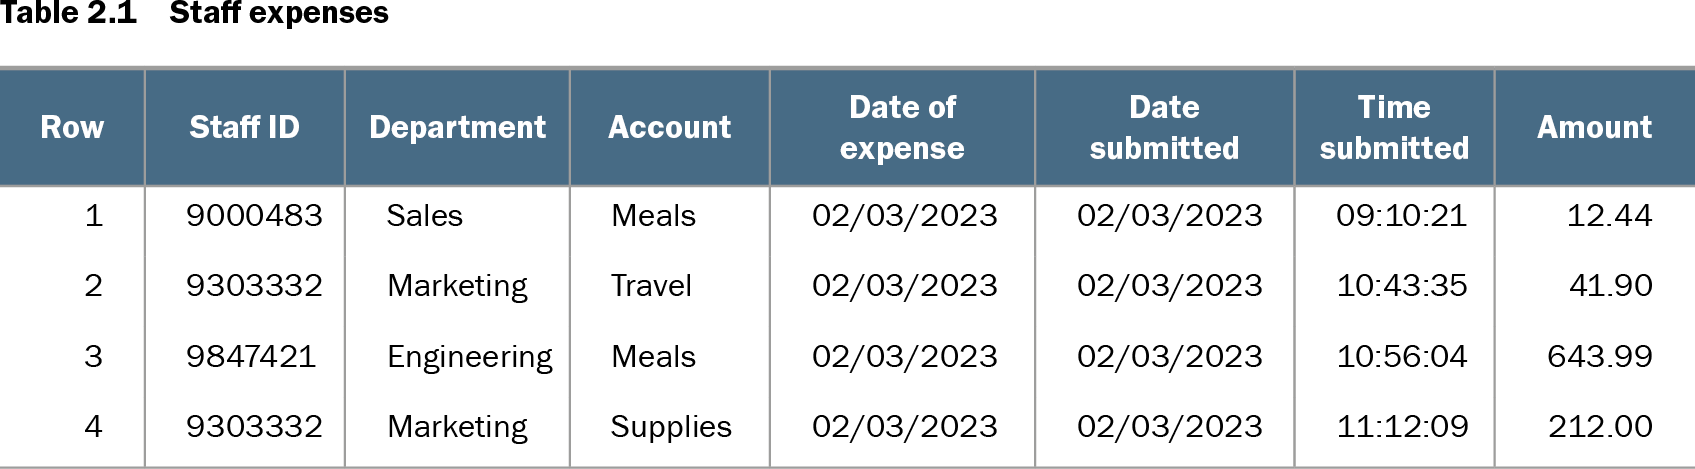
Table 2.1 Staff expenses (view table figure)
| Row |
Staff ID |
Department |
Account |
Date of expense |
Date submitted |
Time submitted |
Amount |
|---|---|---|---|---|---|---|---|
| 1 |
9000483 |
Sales |
Meals |
02/03/2023 |
02/03/2023 |
09:10:21 |
12.44 |
| 2 |
9303332 |
Marketing |
Travel |
02/03/2023 |
02/03/2023 |
10:43:35 |
41.90 |
| 3 |
9847421 |
Engineering |
Meals |
02/03/2023 |
02/03/2023 |
10:56:04 |
643.99 |
| 4 |
9303332 |
Marketing |
Supplies |
02/03/2023 |
02/03/2023 |
11:12:09 |
212.00 |
Inspect expense amounts as a concrete tabular setting for screening unusually small or large numeric values before examining other columns. section 2.0